Mis en avant

En quoi le pergélisol est-il impacté par l’activité humaine?

Par Lucie Peyrache & Maëlys Piat, étudiant ESTA Belfort, 06/2020

Mots-clés: #pergélisol #permafrost #changement climatique #crise environnementale #activités humaines

Dans un monde en perpétuelle évolution, l’humanité a dû apprendre à constamment s’adapter et à trouver de nouvelles solutions à des défis toujours plus complexes. Par tous les moyens, l’Homme cherche à garder un contrôle sur son environnement, rendu presque impossible en raison des multiples dégâts occasionnés avec le temps. On pourrait citer par exemple le déluge du Saugenay en 1996 (Bleau 2002) ou la tempête de verglas au Canada en janvier 1998 (Bednarz 2017), pour démontrer que, dans la société moderne, efficacité et productivité priment sur la protection du climat. Par ailleurs, l’industrialisation des entreprises, l’agriculture intensive ou encore l’augmentation des transports perturbent la variabilité naturelle du climat et la fragilise grandement, ce qui engendre de nombreuses conséquences, comme par exemple la fonte du pergélisol (ou permafrost en anglais).

Qu’est-ce que le pergélisol ?

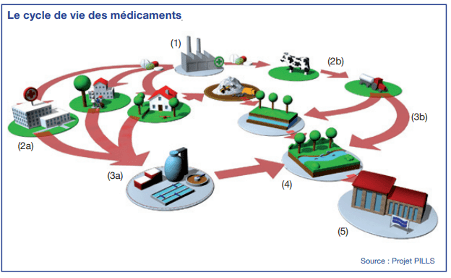
De plus en plus, nous entendons parler du pergélisol, terme utilisé pour décrire les sous-sols gelés en permanence dans les régions alpines, arctiques et antarctiques. Ce qui intéresse et inquiète les scientifiques sont les modifications de ses formations, de son épaisseur et de sa disparition, qui s’expliquent notamment par le changement climatique. Un réseau mondial de scientifiques s’est alors développé pour étudier le pergélisol, principalement en tant qu’indicateur du réchauffement climatique en s’appuyant sur des mesures de températures, des sondages et des suivis satellitaires selon le site Actu-Environnement (©2003). Alors qu’est-ce que les chercheurs ont-ils trouvé au fil du temps ? Tout d’abord, ils ont pu découper le profil thermique du pergélisol en trois catégories distinctes, comme démontrées sur le schéma ci-dessous (ADAPT 2014).

Figure 1 : Structure du permafrost
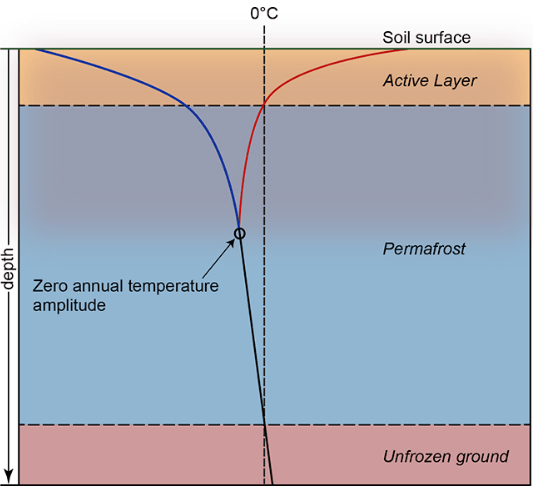
Source : ADAPT (2014)

En premier lieu, on peut repérer la couche de surface (“Active Layer” sur la Figure 1). Cette couche supérieure ne dépasse pas les 0°C en été et dégèle régulièrement, ce qui en fait une couche active qui varie selon les saisons. Son épaisseur varie entre quelques dizaines de centimètres dans les terrains arctiques et jusqu’à 7 mètres dans les terrains alpins. En deuxième lieu, on peut repérer la deuxième couche, celle qui ne dégèle jamais, et qui constitue, au sens strict du terme, le pergélisol. L’épaisseur de cette couche (représentée dans la Figure 1 par le nom “Permafrost”) peut varier entre quelques mètres et 30 mètres en fonction de sa localisation. Par ailleurs cette couche ne subit généralement pas les variations annuelles de température de l’air. En dessous de cette couche de pergélisol se trouve le sol non-gelé (“Unfrozen ground”) (Schoeneich & Fabre 2018).

Comme précédemment expliqué, le pergélisol est un indicateur clé pour évaluer le réchauffement climatique, principalement à cause de sa sensibilité aux changements de température. Selon les prédictions du Centre National pour la Recherche Atmosphérique (NCAR), la quantité de pergélisol mondial pourrait diminuer de 50 % d’ici 2050, jusqu’à ce qu’il n’en reste plus que 10 % en 2100 (Novethic 2013). Il est difficile de s’en rendre compte, mais cela représenterait un rejet de plus de 160 milliards de tonnes de gaz à effet de serre (GES) dans l’atmosphère, avec principalement du protoxyde d’azote N2O et du dioxyde de carbone CO2. Cela représenterait une véritable catastrophe environnementale.

Certes ce profil thermique ne pose aucun souci en théorie, mais il commence à poser problème lorsqu’il se met à dégeler. Ces épisodes de dégels, souvent engendrés par l’augmentation de la température terrestre, entraînent non seulement une modification de la couche active qui se traduit par des modifications de la végétation ainsi que des mouvements importants du sol, mais ils présentent aussi un risque pour l’évolution du climat. En outre, selon la prédiction des scientifiques, le pergélisol contient le plus gros réservoir de dioxyde de carbone continental de la planète, plus gros encore que les réservoirs de pétrole, de gaz et de charbon. De plus, selon l’article publié sur le site Novethic (2013), ces sous-sols renferment aussi d’importantes quantités de matières organiques, en partie composées de méthane, un gaz au pouvoir de réchauffement du climat 25 fois supérieur au CO2 (selon le GIEC). Les sous-sols qui se situent en Russie, par exemple, inquiètent de plus en plus les chercheurs, certains estimant qu’ils pourraient constituer à terme une véritable bombe climatique en raison du méthane enfoui dans ses profondeurs. En prenant un autre exemple, le Canada est un des pays les plus concernés avec plus de 40% de son sol recouvert par du pergélisol. La fonte de ce dernier donne régulièrement lieu à de nombreux affaissements de terrain, engendrant des “lacs” que l’on nomme “lac thermokarstiques”, véritables écosystèmes aquatiques très émetteurs de méthane (Actu-Environnement 2018).

Cependant, les surémissions de gaz à effet de serre ne sont pas les seules catastrophes qui sont engendrées par la fonte du pergélisol. En plus de ce cataclysme environnemental, le permafrost abrite de nombreux virus et bactéries de toutes sortes, comme des “virus géants”. Des recherches effectuées durant les 10 dernières années ont démontré l’existence de plusieurs de ces “virus géants”, dont certains datent de plus de 30 000 ans (comme le Mollivirus Sibericum). Le dégel du pergélisol représente alors aussi une véritable menace sanitaire, comme l’explique l’article de Loumé (2020).

Les activités humaines ont-elles un impact sur l’environnement ?

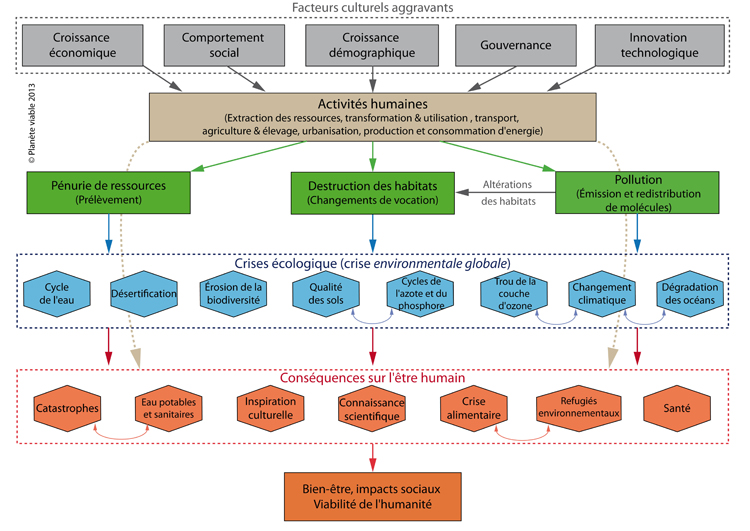
Selon le site Planète Viable écrit par Lefèvre (2013), les activités telles que le prélèvement des ressources, la fabrication de biens, le transport des biens et des personnes, l’agriculture et l’élevage, l’urbanisation, et la production et consommation d’énergie, peuvent être considérées comme ce que l’on nomme des “activités humaines”. Ce sont elles qui sont à l’origine des problèmes environnementaux que nous connaissons aujourd’hui, et qui ont un impact sur la planète ainsi que sur les êtres humains. Par ailleurs, ces impacts sont régulièrement aggravés par d’autres facteurs dits “culturels”. On pourrait citer le comportement social, la croissance de la richesse de certaines populations, les failles de la gouvernance, la croissance démographique et l’innovation technologique (complexification des technologies existantes). Ces impacts environnementaux se manifestent généralement sous la forme de pollution, mais aussi d’épuisement des ressources et de destruction des habitats.

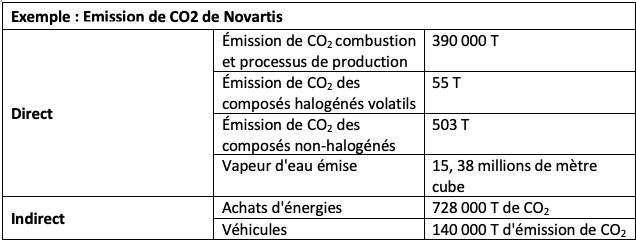
Toutefois, ces impacts ne sont pas indépendants, puisqu’ils génèrent d’autres impacts (par exemple, la pollution contribue à la détérioration des habitats ce qui engendre souvent leur destruction). Les activités humaines ont 3 conséquences directes qui sont à l’origine des crises environnementales. Ces dernières ont des effets locaux autant que globaux et sont regroupées sous le terme de “crise environnementale globale”. Nous pouvons voir sur le schéma ci-dessous (Lefèvre 2013) les liens entre les facteurs culturels aggravants, les activités humaines, leurs impacts directs, la crise environnementale qui en découle et donc ses conséquences sur l’être humain.

Figure 2 : Impact des activités humaines sur l’environnement
Source : Lefèvre (2013)

On peut donc voir sur la Figure 2 que la plupart des crises environnementales sont connectées, ce qui engendre un problème bien plus complexe. Les activités humaines ont également un impact sur l’environnement, ce qui entraîne de nombreuses conséquences, comme l’explique l’article de Lefèvre (2013). Nous pourrions par exemple citer la désertification de nombreuses zones sèches dans le monde (La Rédaction de Futura Planète 2019), la déforestation de nombreuses plantations (FAO 2016), la dégradation de plus en plus flagrante des océans (Messal 2018), la raréfaction de l’ozone stratosphérique (Lefèvre 2013), l’altération de cycles biogéochimiques, l’érosion de diversité biologique (La Rédaction 2019), le réchauffement planétaire, la hausse des océans (Service de la donnée et des études statistiques SDES 2019) ou encore la diminution de la qualité des sols (Molga 2016). Cette liste est bien évidemment non-exhaustive car il existe une multitude d’autres impacts environnementaux, bien plus que nous ne pouvons citer.

Les effets des activités humaines ne font qu’augmenter et leur ampleur ne fait que croître. Il est donc nécessaire d’amorcer des changements sociétaux de grande envergure au plus vite avant que tout cela échappe à tout contrôle.

En quoi impactent-elles le pergélisol ?

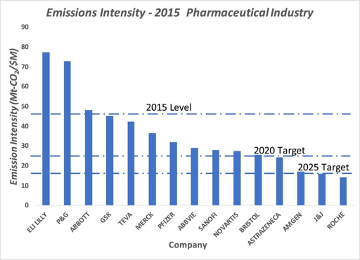
Les activités humaines ne sont généralement pas favorables à la protection de l’environnement puisqu’elles l’impactent de façon directe. Parmi les diverses conséquences environnementales listées précédemment, le réchauffement climatique en est une grave, car, par définition, il impacte la température de l’air. Cela n’a l’air de rien, mais nous savons que le pergélisol est très sensible aux changements de température, et que sa fonte est en général causée par ce facteur. Selon Streletskiy et al. (2015), depuis les années 80, l’Arctique voit sa température augmenter deux fois plus que le rythme mondial. Selon Romanovsky et al. (2010), on dénote aussi que les températures du pergélisol en Russie ont augmenté de 0.5 à 2°C entre 1970 et 2009, et les scientifiques prédisent même une augmentation de 20 degrés jusqu’à 2090 (voir Figure 3). Par ailleurs, ces hausses de température interviennent encore plus dans les zones d’activités humaines. Ces changements de température de l’air comme de l’épaisseur de la neige ont grandement influencé sur la dégradation et la fonte du pergélisol (Streletskiy et al. 2015).

Figure 3 : Changement projeté de températures hivernales entre 1985 et 2090
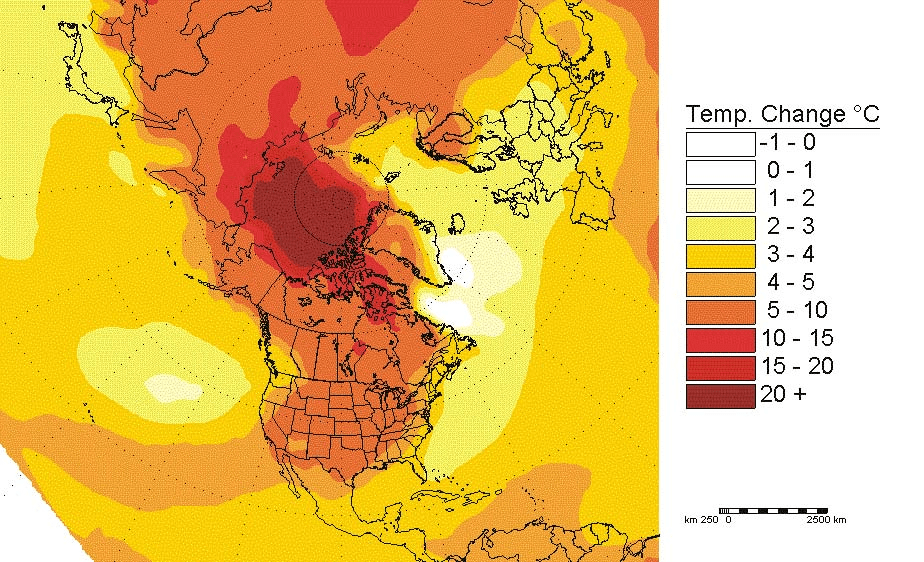
Source : Bourque (2000)

Par nos recherches et selon l’article de Boyer (2019), nous avons pu découvrir en 2019 que suite à la fonte du pergélisol en Arctique, les émissions de protoxyde d’azote avaient atteint en un mois le niveau qui était initialement prévu en un an. Mais ce n’est pas tout. En effet, les chercheurs ont aussi évalué la stabilité du carbone piégé dans les pergélisols des régions polaires comme en Alaska ou en Sibérie et ont pu établir de nombreuses données, comme le fait que ces sols pourraient libérer, au cours des 300 prochaines années cumulées, jusqu’à 10 fois la quantité de gaz carbonique injectée dans l’atmosphère par les activités humaines en 2016 (Boyer 2019).

Pour ce qui est des prévisions, les scientifiques supposent que d’ici 40 à 60 ans, le pergélisol en Arctique deviendra une véritable source permanente de CO2. De plus, au fur mesure que celui-ci fond, il pourrait relâcher jusqu’à 1.700 milliards de tonnes de CO2 dans l’atmosphère (en plus des émissions de méthane) ce qui représente deux fois plus de dioxyde de carbone que n’en contient actuellement l’atmosphère terrestre (Boyer 2019). Pour essayer de réduire et de pallier ces prédictions catastrophiques, l’humanité se doit de s’adapter. Nous pourrions donc développer des exemples concrets mis en place pour éviter la fonte du pergélisol. Prenons des exemples qui se sont passés au Canada depuis les années 2000. D’après l’article de Harris (2010), le pergélisol représente près de 50% de la surface du Canada et il est nécessaire pour les habitants de s’adapter à l’environnement pour éviter toutes conséquences graves comme des affaissements de terrain ou des rejets de méthane ou de CO2. Par conséquent, de nombreuses solutions ont été mises en place, comme la création de “couches isolantes” sur les routes ou les aéroports pour éviter le réchauffement du sol, ou la construction d’habitations sur des piliers pour laisser suffisamment d’air entre le sol et les bâtiments pour éviter de réchauffer le sol (et donc le pergélisol) (Harris 2010).

Conclusion

Par cette étude nous avons pu voir que le pergélisol était en partie impacté par les activités humaines. Cependant et selon les prédictions des chercheurs et scientifiques, cela peut engendrer des conséquences néfastes pour l’avenir. Comme l’avertit Thomas Gasser, chercheur à l’IIASA : “Il existe le danger que, plus nous allions de l’avant, plus nous risquions de déclencher des phénomènes que nous ne comprenons pas” (Gasser 2018). Alors, nous pourrions nous demander s’il n’existe pas de solutions pour pallier ces risques aujourd’hui, afin d’assurer le monde de demain.

Afin de ralentir ou d’éliminer l’avancée des changements climatiques, nous pourrions penser, par exemple d’après Bourque (2000), à la réduction des émissions de gaz à effet de serre directement à la source. Malgré que certaines mesures telles que le protocole de Kyoto aient été mises en place, elles ne font que “retarder” les changements climatiques de plusieurs années (seulement de 15 à 20 ans). Bien qu’un certain nombre soit déjà en vigueur, sont-elles réellement suffisantes pour pallier cette avancée et si non, quelles nouvelles mesures l’Homme pourrait-il mettre en place ?

Références

Actu-Environnement. (©2003). Dictionnaire Environnement – Définition – Pergélisol [online]. Actu-Environnement. [Vu le 04 Mai 2020]. Accessible de : https://www.actu-environnement.com/ae/dictionnaire_environnement/definition/pergelisol.php4

Actu-Environnement. (2018). Réchauffement climatique : l’inquiétante fonte du pergélisol [online]. Actu-Environnement. [Vu le 05 Mai 2020]. Accessible de : https://www.actu-environnement.com/ae/news/rechauffement-climatique-fonte-pergelisol-universcience-TAKUVIK-31942.php4

ADAPT. (2004). Pergélisol 101 [digital image]. [Vu le 05 Mai 2020]. Accessible de : http://www.cen.ulaval.ca/adapt/communications/permafrost101-fr.php

ADAPT. (2004). Pergélisol 101 [online]. ADAPT Arctique en développement et adaptation au pergélisol en transition. [Vu le 05 Mai 2020]. Accessible de : http://www.cen.ulaval.ca/adapt/communications/permafrost101-fr.php

Bednarz, N., (2017). Montréal sous la tempête du verglas, janvier 1998 [online]. Archives Montréal. [Vu le 07 Mai 2020]. Accessible de : http://archivesdemontreal.com/2017/12/20/montreal-sous-la-tempete-du-verglas-janvier-1998/

Bleau, H., (2002). L’effet des inondations de juillet 1996 sur les lacs et rivières de la région du Saguenay : contamination de l’eau, des sédiments et des poissons par les substances toxiques. Direction du suivi de l’état de l’environnement. Québec : Ministère de l’Environnement, Gouvernement du Québec. Envirodoq n° ENV/2002/0283. 59 p. et 12 annexes.

Bourque, A., (2000). Changement projeté de températures hivernales entre 1985 et 2090 considérant les effets combinés des augmentations prévues de gaz à effet de serre et d’aérosol de sulfate selon le Modèle Couplé de la Circulation Générale 1 d’Environnement Canada. [digital image] [Vu le 06 Mai 2020]. Accessible de : https://journals.openedition.org/vertigo/docannexe/image/4042/img-8.png

Bourque, A., (2000). Les changements climatiques et leurs impacts [online]. OpenEdition. [Vu le 08 Mai 2020]. Accessible de : https://doi.org/10.4000/vertigo.4042

Boyer, F., (2019). La fonte du pergélisol menace de libérer massivement un puissant gaz à effet de serre [online]. Futura Planète. [Vu le 11 mai 2020]. Accessible de : https://www.futura-sciences.com/planete/actualites/climatologie-fonte-pergelisol-menace-liberer-massivement-puissant-gaz-effet-serre-59701/

FAO. (2016). Situations des forêts du monde 2016. Forêts et agriculture: défis et possibilités concernant l’utilisation des terres. Rome : FAO 2016.

Gasser, T., (2018). Path-dependent reductions in CO2 emission budgets caused by permafrost carbon release [online]. Nature Geoscience. 11, 830-835(2018) [Vu le 08 Mai 2020]. Accessible de : DOI: https://doi.org/10.1038/s41561-018-0227-0

Harris, S.A, (2010). Pergélisol [online]. L’encyclopédie Canadienne. [Vu le 05 Mai 2020]. Accessible de : https://www.thecanadianencyclopedia.ca/fr/article/pergelisol

La Rédaction. (2019). Érosion de la biodiversité : un constat inquiétant [online]. Vie Publique. [Vu le 06 Mai 2020]. Accessible de : https://www.vie-publique.fr/eclairage/271780-erosion-de-la-biodiversite-un-constat-inquietant

La Rédaction de Futura Planète. (2019). Désertification [online]. Futura Planète. [Vu le 05 Mai 2020]. Accessible de : https://www.futura-sciences.com/planete/definitions/geographie-desertification-410/

Lefèvre, T., (2013). La gouvernance du trou de la couche d’ozone: un exemple à suivre [online]. Planète Viable. [Vu le 05 Mai 2020]. Accessible de : https://planeteviable.org/gouvernance-trou-couche-ozone/

Lefèvre, T., (2013). Les activités humaines, leurs impacts, la crise environnementale globale et les crises humaines [online]. Planète Viable. [Vu le 06 Mai 2020]. Accessible de : https://planeteviable.org/activites-humaines-impacts-crise-environnementale-globale-crises-humaines/

Lefèvre, T., (2013). Schéma des liens entre les activités humaines et les facteurs « culturels » qui les aggravent, leurs conséquences directes (impacts directs), les crises environnementales que des dernières engendrent et leurs conséquences humaines. Certains existants entre les divers paramètres sont indiqués par des flèches à titre indicatif [digital image]. [Vu le 06 Mai 2020]. Accessible de : https://planeteviable.org/wp-content/uploads/2013/10/Crises-enviro_Causes-Effets-fr_Modif-72px.jpg

Loumé, L., (2020). Question de la semaine : la fonte du permafrost est-elle une menace pour l’humanité ? [online]. Science et Avenir. [Vu le 05 Mai 2020]. Accessible de :

https://www.sciencesetavenir.fr/nature-environnement/climat/question-de-la-semaine-la-fonte-du-permafrost-est-elle-une-menace-pour-l-humanite_142207

 Messal, R., (2018). Océans : les effets du plastique sur les animaux et l’environnement [online]. Futura Planète. [Vu le 05 Mai 2020]. Accessible de : https://www.futura-sciences.com/planete/dossiers/pollution-dechets-plastique-mer-septieme-continent-1898/page/4/

Molga, P., (2016). La fertilité des sols part en poussière [online]. Les Echos. [Vu le 06 Mai 2020]. Accessible de : https://www.lesechos.fr/2016/01/la-fertilite-des-sols-part-en-poussiere-191459

Novethic. (2013). Permafrost [online]. Novethic. [Vu le 03 Mai 2020]. Accessible de : https://www.novethic.fr/lexique/detail/permafrost.html

Romanovsky, V., Drozdov, D., Oberman, N., Malkova, G., Kholodov, A., Marchenko, S., Moskalenko, N., Sergeev, D., Ukraintseva, N., Abramov, A., (2010). Thermal state of permafrost in Russia [online]. Permafrost and Periglacial Processes. [Vu le 06 Mai 2020]. Accessible de : https://doi.org/10.1002/ppp.683

Schoeneich, P., Fabre, D., (2018). Le Permafrost [online]. Encyclopédie de l’environnement. [Vu le 05 Mai 2020]. Accessible de : https://www.encyclopedie-environnement.org/sol/le-permafrost/

Service de la donnée et des études statistiques SDES. (2019). Elévation du niveau de la mer – L’environnement en France [online]. Développement-durable.gouv. [Vu le 05 Mai 2020]. Accessible de : https://ree.developpement-durable.gouv.fr/themes/milieux-et-territoires-a-enjeux/mer-et-littoral/etat-du-milieu-marin-et-littoral/article/elevation-du-niveau-de-la-mer

Streletskiy, D., Alexander, V., Anisimov, O. A. (2015). Permafrost Degradation. Snow and Ice-Related Hazards, Risks, and Disasters [online]. 303-344. [Vu le 08 Mai 2020]. Accessible de : DOI: 10.1016/B978-0-12-394849-6.00010-X

Mis en avant

Fast-Fashion : Et si la planète changeait de look aussi vite que nous?

Par Élise Hildenbrand & Félix Koegler, étudiants ESTA Belfort, 06/2020

Mots-clés: #Fast-Fashion #Industrie textile #Surconsommation #Pollution

Une consommation à l’image du PIB

Dans une société où la consommation ne fait qu’augmenter, l’industrie du textile fait partie intégrante des excès de cette consommation (Le Monde 2020). En France, la consommation des ménages suit étroitement la tendance du PIB par habitant en croissance (Figure 1). Effectivement, cela semble logique car si les personnes ont plus de ressources, elles peuvent naturellement satisfaire plus de besoins, ce qui se traduit par une augmentation de la consommation.

Consommation des ménages par rapport au PIB par habitant en France
Sources : Banque Mondiale (2019) ; INSEE (2018) [Réalisé par les auteurs]

L’industrie textile profite pleinement de cette société de consommation. A l’instar des Fast-Food, les géants du vêtement suivent un nouveau business model : la Fast-Fashion (Le Monde 2020).

La Fast-Fashion : des quantités accrues et renouvelées très rapidement

Le terme Fast-Fashion tend à décrire un renouvellement très rapide des vêtements et des styles proposés à la vente (Brooks 2015).

Si on remonte quelques années en avant, en 1980, l’industrie textile était basée sur une production de masse à bas coût de vêtements standardisés. La société semblait porter moins d’importance à la mode qu’aujourd’hui. L’apparition de vêtements plus stylés a eu pour conséquence une baisse de la demande pour les biens dits standards.

Ainsi, la mode a été considérée comme quelque chose de volatile ou a minima cyclique. Les industriels se sont donc adaptés en créant l’existence de saisons dans leur gamme de vêtements (Bhardwaj & Fairhurst 2010).

Par la suite, les acteurs du marché ont eu la volonté de répondre toujours plus rapidement aux nouvelles modes. Cela a donc créé une expansion du nombre de saisons proposé par année. Nous sommes alors passés de deux saisons par an à six voir même huit. Pire, ZARA (dont le cas sera détaillé par la suite) propose 12 000 vêtements différents par an (Solène Martin 2017).

Cette volonté de créer des saisons a donc eu pour conséquence un glissement de la logique de production de masse vers des productions de lots beaucoup plus réduits.

Si, à première vue, produire en petite quantité n’est pas ce qui semble être le plus rentable, cela apporte tout de même plusieurs avantages. Premièrement, ces petites quantités permettent aux géants du Fast-Fashion de ne pas réellement se soucier d’éventuelles erreurs d’appréciation des tendances. Par ailleurs, et côté client cette fois-ci, ces quantités très limitées procurent une sensation d’exclusivité, ne faisant alors que renforcer l’envie d’acheter – continuellement – des habits que seul un petit nombre de personnes pourra acquérir (LinkedIn 2018).

De plus, et grâce à la mondialisation, la production de petites séries et à bas coûts est devenue possible. Les géants du prêt à porter font alors produire les vêtements dans des pays où la main d’œuvre n’est pas chère (Le Monde 2020).

Par ailleurs, le développement du digital et des ventes en ligne ne fait qu’accélérer le processus. Par exemple, entre 2000 et 2014, la vente d’habits a doublé ; passant de 50 à 100 milliards d’unités vendues dans le monde (Ellen MacArthur Foundation 2017). Il est intéressant de noter que, comme pour la consommation générale, cette augmentation du nombre de vêtements consommés par personne n’est pas sans rapport avec l’augmentation du PIB par habitant. Par exemple, aux Etats-Unis, nous pouvons voir que la consommation d’habits suit la tendance du PIB par habitant (Figure 2).

Consommation annuelle moyenne de vêtements par Nord-Américain (USA) comparée au PIB par habitant
Sources : Banque Mondiale (2019) ; The Atlas (2018) [Réalisé par les auteurs]

La Fast-Fashion est incarnée par la célèbre marque Zara. En effet, c’est l’une des pionnières en la matière et elle fait figure d’exemple pour toutes les enseignes de Fast-Fashion.

L’histoire de Zara commence en 1963, lorsque que Amancio Ortega, le fondateur de l’enseigne ouvre son entreprise « Confecciones Goa ». Il a alors pour but de révolutionner le monde de la mode en proposant des vêtements tendances et à bas coût. Pour baisser le prix, il cherche à réduire les intermédiaires et internalise sa production.

La première boutique « Zara » ouvre en 1975 à La Corogne en Espagne. Au vu de son succès, dès 1988 la marque s’installe au Portugal puis à New-York l’année d’après (Entreprendre 2017). Aujourd’hui, Zara possède 2 131 boutiques dans le monde et fait partie du groupe Inditex, leader du marché qui ne comptabilise pas moins de 7 490 boutiques dans le monde au total (Statista 2019).

Zara propose des vêtements qui s’inspirent des grandes marques de luxe à des prix abordables. De plus les collections sont renouvelées très fréquemment. Ainsi, contrairement à des marques classiques qui renouvellent leurs collections deux à quatre fois par an, Zara renouvelle 40% de sa collection chaque semaine ! Cela est favorisé par une très bonne structure logistique (Entreprendre 2017). Aujourd’hui, le groupe Inditex possède un chiffre d’affaires de plus de 26,15 milliards d’euros (Boursorama 2020).

L’industrie textile : 10 000 litres d’eau et une fois et demie le tour de la Terre pour la production d’un jean, six fois la quantité de déchets plastiques du 7ème continent

Comme évoqué dans la partie précédente, la Fast-Fashion augmente la consommation de vêtements. Il n’est pas sans rappeler qu’en moins de deux décennies (2000-2014), le nombre de vêtements vendus a été multiplié par deux (Le Monde 2020). Mais, quels sont les impacts de cette industrie sur l’environnement ? Avant d’aller plus loin, il semble intéressant de suivre le chemin d’un jean entre sa production jusqu’à son achat.

La Fast-Fashion utilise la mondialisation à outrance, ainsi un vêtement parcourt le monde entier lors de sa production. L’impact écologique de la Fast-Fashion peut être illustré avec l’exemple d’un vêtement standard de notre garde-robe : le jean. Il s’en vend 2,3 milliards dans le monde tous les ans, et 92,5 millions en France (Planétoscope 2013). Cependant, un jean est un vêtement dont la production représente un impact environnemental très fort. Le trajet d’un jean depuis sa production jusqu’à son arrivée dans les rayons des grandes enseignes de mode illustre cet impact. Une ville chinoise a fait de la toile de jean sa spécialité : Xintang. Un jean vendu dans le monde sur trois provient de cette ville, ce qui lui vaut le surnom de « capitale du jean » (Brut 2019, Courrier International 2011). Finalement, comme nous pouvons le voir sur les documents ci-après (Figures 3 et 4), pour être créé, le jean parcourt le monde. Lorsqu’il arrive dans les boutiques, le jean a déjà parcouru plus de 63000 km soit une fois et demie le tour de la terre. Il a par ailleurs aussi utilisé plus de 10 000 litres d’eau et de nombreux produits toxiques (Brut 2019, Ça m’intéresse 2020, Ademe 2019).

Parcours de la fabrication d’un jean
Source : Brut (2019) [Réalisé par les auteurs]
Le trajet d’un jean : une fois et demie le tour de la Terre
Sources : Ademe (2018), Brut (2019), Courrier International (2011), Je consomme responsable (2013), Statista (2019) [Réalisé par les auteurs]

De plus, l’industrie textile est très polluante. Comme nous pouvons le voir sur le graphique ci-dessous, 70% des vêtements sont fabriqués à partir de polyester, un dérivé du pétrole. C’est d’ailleurs depuis l’arrivée de la Fast-Fashion dans les années 2000 que la part de vêtements fabriqués à base de Polyester a explosé (Figure 5).

Parts de l’utilisation des matériaux textiles
Source : Greenpeace (2016)

En plus de provenir d’une ressource fossile limitée, cette matière provoque également la pollution des eaux. Effectivement, cette matière relâche des microfibres plastiques à chaque lavage. On estime à 500 000 tonnes la masse de ces microfibres plastiques relâchées dans les océans chaque année (Ademe 2018, 2019).

Cela représente plus de 6 fois la quantité de déchets plastiques formant le 7ème continent. Nous qui étions déjà stupéfaits de savoir qu’un continent de plastique, trois fois plus grand que la France flottait dans les eaux du pacifique… Pour ce qui est des autres matières, les impacts sont moindres mais significatifs tout de même. Le coton, représentant 25% de la production de fibre textile, implique l’utilisation de pesticides durant sa culture. Cette utilisation ne représente pas moins de 16% des pesticides utilisés à l’échelle mondiale. De plus, l’utilisation d’engrais est aussi nécessaire et représente 4% de l’utilisation mondiale. Ces produits nocifs s’infiltrent ensuite dans les nappes phréatiques favorisant alors la prolifération d’algues au détriment d’autres espèces marines (Ademe 2019, CTB 2011).

Les autres matières de type viscose ou lyocell nécessitent aussi l’utilisation de produits chimiques très toxiques. On notera l’utilisation d’hydroxyde de sodium, d’acide sulfurique et surtout de disulfure de carbone. Ces substances pouvant causer de graves maladies (Ademe 2019).

En outre les matières premières, la teinture des fibres est aussi très polluante. L’utilisation de plusieurs substances toxiques pour teindre les vêtements engendre, lors du lavage de ces derniers, pas moins de 20% de la pollution des eaux mondiales. Elle pollue aussi beaucoup les rivières des villes produisant la toile de jean, ce qui représente un risque sanitaire indéniable pour la population (Ademe 2019).

Pour couronner le tout, la pollution de l’air est aussi présente. Effectivement, entre la fabrication, les transports et la logistique ainsi que l’usage des vêtements (nettoyage, séchage, fer à repasser etc.), l’industrie textile émet entre 2 et 3% des émissions mondiales de gaz à effet de serre par an (Ellen MacArthur Foundation 2017, Ademe 2018, Greenpeace 2016).

Néanmoins, l’industrie de textile ne fait pas que polluer ; elle consomme aussi plusieurs ressources.

Premièrement, toutes les substances chimiques utilisées impliquaient en 2015 l’utilisation de 98 millions de tonnes de pétrole. En effet, la production de fibres textiles ainsi que sa coloration et ses finitions sont très gourmandes en pétrole. De même, les engrais utilisés pour la culture de coton sont synthétisés à partir de dérivés de pétrole (Ellen MacArthur Foundation 2017).

Par ailleurs, la fabrication de vêtements consomme beaucoup d’eau. Rien que pour fabriquer un tee-shirt il faut compter 2700 litres d’eau. Encore pire, un jean nécessite entre 7000 et 11 000 litres d’eau. Ainsi, l’industrie du textile consomme 4% de l’eau potable disponible sur terre. Une fois dans nos dressings, ces vêtements sont encore grands consommateurs d’eau ; il faut les laver. C’est ainsi que les foyers français ne consomment pas moins de 14 000L d’eau par an pour laver leurs vêtements. Cela représente environ 12% de l’eau consommée par le foyer en un an (Ademe 2018,2019).

De plus, l’utilisation de l’électricité est aussi à prendre en compte. Effectivement, il semble logique que la consommation d’électricité ait un lien étroit avec la production.

Même si la consommation électrique engendrée par la production de la Fast-Fashion est difficile à définir, nous pouvons tout de même noter que 5% de la note d’électricité des foyers français sont consacrés uniquement au fonctionnement de la machine à laver (Total Direct Energie 2019). Du côté éthique, une fois encore l’industrie du textile est responsable de plusieurs problèmes. La santé des personnes est la première touchée par cette industrie. Effectivement, les agents chimiques utilisés pour produire, colorer ou même encore vieillir (car oui, on veut acheter des vêtement neufs, mais pas trop), sont, pour beaucoup d’entre eux, nocifs pour la santé (Ademe 2018).

Par ailleurs, et comme vu précédemment, la consommation mondiale a doublé en moins de 15 ans. Cependant, la capacité de production des infrastructures n’a pas forcément pu suivre le même chemin. Ainsi cela oblige certains travailleurs à être surexploités et mène à des accidents industriels fréquents. Par exemple au Bangladesh, 579 personnes sont mortes dans des incendies d’usine entre 2009 et 2013 (Ademe 2018).

On peut aussi parler des animaux qui ne sont pas laissés pour compte. L’utilisation de matière animale pour la confection de vêtements ne représente qu’une petite partie de la production, néanmoins les animaux vivent souvent dans des conditions difficiles. Par exemple, l’Australie élève des moutons de manière intensive. Cela en fait le premier producteur de laine au monde (Ademe 2018). Par ailleurs, les vêtements se consomment de plus en plus vite. Même si en Europe cela reste stable, le nombre de fois qu’un vêtement est porté avant de finir à la poubelle dans le monde diminue au fil du temps (Ellen MacArthur Foundation 2017).

Nombre de fois moyen qu’un vêtement est porté avant d’être jeté (en incluant la réutilisation)
Source : Ellen MacArthur Foundation 2017

Ainsi, 73% des vêtements finissent à la poubelle même si certains d’entre eux sont encore utilisables. Les habits encore utilisables jetés représentent une perte d’environ 460 milliards de dollars par an (Ellen MacArthur Foundation 2017).

Et demain ? Que fait-on ?

Finalement, après avoir découvert tous ces éléments, une question se pose : Et si la planète s’habillait de façon plus responsable ?

Bien que nous ayons déjà plus ou moins entendu parlé du sujet, nous ne nous attendions pas à de telles révélations. En effet, en tant qu’étudiants, il est fréquent pour nous de nous fournir dans les grandes enseignes telles que H&M et Zara. Cette réflexion nous a ouvert les yeux et nous montre que le changement vers un mode de vie plus responsable pour l’environnement ne se réduit pas au fait de faire attention à notre consommation énergétique ou à nos modes de transport. Heureusement, face à cette industrie très polluante, plusieurs solutions sont possibles. Premièrement, un programme « détox » a été mis en place par Greenpeace afin de dénoncer l’usage de produits chimiques nocifs par les producteurs de vêtements ainsi que la pollution des cours d’eau qu’il engendre. Grâce à cela, 80 enseignes ont signé une charte en 2011 s’engageant à réduire leur impact environnemental, parmi elles figurent par exemple Inditex (Zara), H&M, C&A (Greenpeace 2018). Par ailleurs, de plus en plus de solutions pour réutiliser ou recycler les vêtements existent. On peut citer par exemple l’application Vinted qui permet aux utilisateurs d’acheter et revendre des vêtements d’occasion (Vinted 2020).

Références

ADEME., (2018), La mode sans dessus-dessous [online]. ADEME. [Viewed 9 May 2020]. Available from: https://multimedia.ademe.fr/infographies/infographie-mode-qqf/

Bhardwaj, V., Fairhurst, A., (2010). Fast fashion: response to changes in the fashion industry. The International Review of Retail, Distribution and Consumer Research [online]. 20(1), 165–173. [Viewed 9 May 2020]. Availabe from: DOI: 10.1080/09593960903498300.

Boursorama., (2020). Inditex [online]. Boursorama [Viewed 10 May 2020]. Available from : https://www.boursorama.com/cours/societe/chiffres-cles/FF55-ITX/

Brooks, A., (2015). Clothing Poverty: The Hidden World of Fast Fashion and Second-Hand Clothes. 2nd Ed. Google Books: Zed Books Ltd.

Brut., (2019), Jamy retrace l’itinéraire d’un jean [online]. YouTube. [Viewed 9 May 2020]. Available from: https://www.youtube.com/watch?v=U9xoi7RSOwo

Cobbing, M., Vicaire, Y., (2016). Timeout for fast fashion [online]. Hamburg: Greenpeace e.v. [Viewed 9 May 2020]. Available from: https://storage.googleapis.com/planet4-international-stateless/2018/01/6c356f9a-fact-sheet-timeout-for-fast-fashion.pdf

Cobbing, M., Vicaire, Y., (2018) Destination Zéro : impacts de sept ans de campagne Detox sur l’industrie du vêtement [online]. Hamburg, Greenpeace [ Viewed 10 May 2020]. Available from : https://cdn.greenpeace.fr/site/uploads/2018/07/R%C3%A9sum%C3%A9-Detox-018.pdf?_ga=2.92579997.1248404837.1531301779-1989101024.1530001735*

https://cdn.greenpeace.fr/site/uploads/2018/07/R%C3%A9sum%C3%A9-Detox-2018.pdf?_ga=2.92579997.1248404837.1531301779-1989101024.1530001735*

Creusillet, S., (2020). Combien coûte vraiment un jean ? [online]. Ca m’intéresse [Viewed 10 May 2020]. Available from : https://www.caminteresse.fr/economie-societe/combien-coute-vraiment-un-jean-11138006/

CTB, Agence belge du développement., (2011) La filière du coton une mondialisation cousue de fil blanc [online]. Bruxelles : CTB [Viewed 10 May 2020]. Available from : https://www.befair.be/drupal_files/public/all-files/brochure/Brochure%20coton-FR-BD.pdf

Ellen MacArthur Foundation., (2017). A new textiles economy: Redesigning fashion’s future [online]. Cowes: Ellen MacArthur Foundation. [Viewed 9 May 2020]. Available from: https://www.ellenmacarthurfoundation.org/publications/a-new-textiles-economy-redesigning-fashions-future#purchase-options

Entreprendre, (2017). Zara : comment Amancio Ortega Gaona est devenu le roi du monde [online]. Entreprendre. [Viewed 10 May 2020].Available from: https://www.entreprendre.fr/fondateur-de-zara/

Garnier, J., (2020). « L’industrie textile est emblématique de tous les excès de la société de consommation » [online], Le Monde. [Viewed 9 May 2020]. Available from: https://www.lemonde.fr/economie/article/2020/02/25/l-industrie-textile-est-emblematique-de-tous-les-exces-de-la-societe-de-consommation_6030747_3234.html

Godoy Hilario, P-M., (2019). Production mondiale de coton par pays 2018-2019 [online]. Statista [Viewed 10 May 2020] Available from : https://fr.statista.com/statistiques/564963/production-mondiale-de-coton-par-pays/

Groupe Banque mondiale., (2019). PIB par habitant ($ US constants de 2010) [Data Set], La Banque mondiale.[Accessed 9 May 2020]. Available from: https://donnees.banquemondiale.org/indicator/NY.GDP.PCAP.KD

INSEE., (2018). Consommation des ménages en 2018 [Data set]. INSEE.[Accessed 9 May 2020]. Available from: https://www.insee.fr/fr/statistiques/4131372

Je consomme responsable (2013). Le coton en quelques chiffres [online]. Je consomme responsable, [Viewed 10 May 2020]. Available from : http://www.jeconsommeresponsable.fr/de-a-a-z/comprendre/362-le-coton-en-quelques-chiffres.html

Martin, S., (2017). #13 QU’EST-CE-QUE LE FAST FASHION ? Solène Martin. [Viewed 9 May 2020]. Available from: https://www.solenemartin.com/13-quest-ce-que-le-fast-fashion/

Michel, L.,(2018). Les secret du leader de la fast fashion : Zara [online], LinkedIn. [Viewed 9 May 2020]. Available from: https://www.linkedin.com/pulse/les-secrets-du-leader-de-la-fast-fashion-zara-laura-michel

Mingzhuo, J., (2011). Voyage au cœur de la capitale du jean [online]. Courrier international [Viewed 10 May 2020]. Available from : https://www.courrierinternational.com/article/2011/03/03/voyage-au-coeur-de-la-capitale-du-jean

Planétoscope., (2013). Nombre de jeans vendus dans le monde [online]. Planetoscope [Viewed 10 May 2020]. Available from: https://www.planetoscope.com/Commerce/1210-nombre-de-jeans-vendus-dans-le-monde.html

Quehe, I., Sarfati Leduc, H., Grand Mourcel, S., Ruelle, N., Rinck, A., (2019). Le revers de mon look [online]. Angers : ADEME. [Viewed 9 May 2020]. Available from: https://www.ademe.fr/sites/default/files/assets/documents/le-revers-de-mon-look.pdf

Satista., (2019). Nombre de points de vente du groupe Inditex en janvier 2016 et 2019, par marque [online]. Statista. [Viewed 10 May 2020]. Available from : https://fr.statista.com/statistiques/543840/inditex-nombre-points-vente-marque-monde/

The Atlas., (2018). Average annual clothing consumption per person in the US [online]. The Atlas. [Viewed 9 May 2020]. Available from: https://theatlas.com/charts/r1qho_XPM

Total Direct Energie., (2019), Zoom sur la consommation électrique d’une machine à laver [online]. Total Direct Energie. [Viewed 9 May 2020]. Available from: https://total.direct-energie.com/particuliers/parlons-energie/dossiers-energie/economie-d-energie/zoom-sur-la-consommation-electrique-d-une-machine-a-laver

Vinted., (2020). Vinted [Viewed 10 May 2020]. Available from: https://www.vinted.fr/

Mis en avant

Labellisation de la Finance Responsable: Greenwashing vendeur ou véritable engagement environnemental ?

Par Benjamin Steibel, étudiant ESTA Belfort, 05/2020

Mots-clés: #ESG #ISR #Investissement durable

Désormais habitué à être au centre des controverses, Blackrock, l’ogre de l’asset management, vient d’être choisi comme conseiller de l’UE sur les problématiques d’intégration des critères sociaux et environnementaux dans la supervision bancaire (Financial Times, 2020). Choix surprenant, quand on sait que l’Américain investit plus de $87Mds dans les énergies fossiles. Toutefois, la compagnie dirigée par Larry Fink, comme tout l’écosystème financier des années 2010’, se revendique désormais « responsable » et « durable ». Une industrie qui serait donc en pleine mutation, mutation qui se caractériserait par l’apparition des fonds d’investissement ESG[1] et autres label ISR[2] ou Greenfin[3], tous deux créés par l’Etat Français et qui font office de « golden standard » sur le marché de la finance responsable. Toutefois, quel crédit donner à cette soudaine effervescence autour de la finance « responsable »[4] ?  La dernière décennie est indéniablement celle qui aura vu exploser la somme d’actifs sous gestion (AUM) selon les principes ESG. Une prolifération justifiée par la fréquente surperformance financière des entreprises intégrant ces critères à leur modèle[5] et amplifiée par les résultats d’une étude de l’ONG Américaine Majority Action. Une étude prouvant que durant les votes aux assemblées générales des entreprises, nombre de sociétés de gestion votaient contre une grande partie des résolutions favorables au climat (The Guardian, 2019). Un résultat qui a amené nombre d’investisseurs institutionnels (qui sont les principaux clients des fonds « responsables ») à pousser ces gérants à intégrer les concepts de durabilité à leur processus d’investissement. Si bien qu’aujourd’hui, la quasi-totalité des gérants d’actifs sont signataires des PRI[6] avec environ $86Tn d’actifs gérés (UNPRI, 2019).

Croissance des signataires des PRI (Principles for Responsible Investment)
Source: UNPRI
Label ISR & Label Greenfin – 2020
Sources : Label ISR / Ministère de la Transition Ecologique et Solidaire

Toutefois, le fossé entre les gérants signataires de ces principes et ceux dont les fonds sont labellisés ISR/Greenfin demeure immense. Avec un total de €163Mds, les fonds labellisés représentent moins de 0,15% de la totalité des actifs gérés par les signataires des UNPRI.

Cette auto-proclamée « finance responsable » pourrait donc vite sonner comme un doux oxymore, comme pur greenwashing. Si le nombre de fonds ESG a augmenté de manière exponentielle, les études et autres preuves quant à la véracité de leur aspect durable et de leur impact environnemental se font rares. Nombre de fonds se présentent sous la bannière « ESG » sans en apporter aucune preuve, si ce n’est en devenant signataire de principes étant devenus les nouvelles normes de l’industrie financière.

Toutefois, il serait trop simple de blâmer ces sociétés de gestion car ce phénomène de greenwashing autour de la finance responsable vient de l’essence même de celle-ci.

Aujourd’hui, le principal ennemi de l’investissement ESG, c’est l’ESG en lui-même. Un terme dont la définition diffère entre chaque acteur :

  • “l’ESG signifie l’utilisation des critères environnementaux, sociaux et de gouvernance pour évaluer les entreprises et les pays sur leur politique de durabilité“ (Robeco, traduit de l‘anglais)
  • “l’ESG est la prise en compte des facteurs environnementaux, sociaux et de gouvernance aux côtés des facteurs financiers dans le processus de décision d’investissement. “ (MSCI, traduit de l’anglais)
  • “Les critères ESG […] sont des critères d’analyse qui permettent d’évaluer la prise en compte du développement durable et des enjeux de long terme dans la stratégie des entreprises. Ces critères peuvent par exemple être:
  • Les émissions de CO2, la consommation d’électricité, le recyclage des déchets pour le pilier E
  • La qualité du dialogue social, l’emploi des personnes handicapées, la formation des salariés pour le pilier S
  • La transparence de la rémunération des dirigeants, la lutte contre la corruption, la féminisation des conseils d’administration pour le pilier G (Le label ISR)

Si la notion de durabilité reste commune, la façon de l’évaluer ne l’est pas. En effet, seuls certains critères sont, selon les analystes de l’équipe Active Quantitative Equity (AQE) de State Street Global Advisor, applicables à l’ensemble des entreprises (empreinte carbone et émissions de ges notamment) (Option Finance, 2018). Or, comme cité précédemment, le label ISR fait état d’indicateurs ne respectant pas ce critère « d’universalité » entre les entreprises.

Un phénomène qui résulte en une non-standardisation des indicateurs d’impact ainsi que des données ESG hétérogènes et peu fiables sur les entreprises dans lesquelles investissent les gérants de fonds « durables ». Des divergences qui compliquent les comparaisons à l’échelle mondiale et bloquant la mise en place d’un système de notation représentatif de la performance ESG de chaque entreprise cotée. C’est en grande partie à cause de ces divergences que la teneur environnementale des fonds signataires des PRI est questionnable. En revanche, on pourrait se rassurer en se disant que les fonds labellisés sont gérés par des véritables puristes de l’investissement durable. Et là encore, un rapide examen des « critères d’éligibilité » à ces labels donne envie de crier au greenwashing. Et pour cause, ces critères[7] sont majoritairement qualitatifs : « la société de gestion du fonds candidat fournit une présentation décrivant la stratégie de sélection des actifs ESG… » (Label ISR) et nullement standardisés « Le fonds candidat doit avoir mis en place un mécanisme de mesure de la contribution effective de ses investissements à la transition énergétique et écologique. » (Greenfin). Un mécanisme de mesure. Reste donc à savoir lequel.

Mais tout de même, ces labels étant gérés par le gouvernement Français, un raisonnement naïf serait de se dire qu’un contrôle strict est réalisé et que leur nature durable n’est pas questionnable. Se pose dès alors la question centrale de tout investisseur « vert » lambda : quel label choisir pour diminuer l’intensité carbone de son portefeuille d’investissement tout en visant un certain degré de performance financière ?

Si le label Greenfin semble plus centré sur la problématique environnementale que le label ISR, qui lui se soucie également des thématiques sociales et de gouvernance, la comparaison reste compliquée à établir. A ce jour, peu de gérants d’actifs cumulent les deux labels différents. Toutefois, pour un investisseur souhaitant investir sur le stock market Européen[8], 3 gérants peuvent se targuer d’avoir les deux labels dans leur collection de fonds.

Mais encore une fois, une rapide comparaison de l’intensité carbone[9] des fonds proposés par ces 3 gérants vient décrédibiliser les deux labels.

HSBC
Source: HSBC Factsheet. Portefeuilles arrêtés au 28/02/2020.
Les données de consommation sont relatives aux entreprises présentes dans le fonds d’Investissement. L’index[10] utilisé est celui fourni par HSBC.
La Banque Postale Asset Management
Source: LBPAM Factsheet. Portefeuilles arrêtés au 28/02/2020.
Les données de consommation sont relatives aux entreprises présentes dans le fonds d’investissement. L’index utilisé est celui fourni par LBPAM.
Sycomore Asset Management
Source: Sycomore AM Factsheet. Portefeuilles arrêtés au 31/03/2020.
Les données de consommation sont relatives aux entreprises présentes dans le fonds d’Investissement. L’index utilisé est celui fourni par Sycomore AM.

Si les fonds labellisés tiennent leur promesse de surperformance économique (exception faite des fonds Sycomore, qui affichent des résultats post-impact de l’épidémie de covid-19 sur la zone Euro) , la promesse écologique est, elle, loin d’être tenue. Aucune tendance ne se dessine quant à la qualité énergétique d’un type de fonds. Plus surprenant encore, les fonds Greenfin sont les moins « verts » et ne publient pas systématiquement de données relatives à leur intensité carbone.

Dans certains cas de figures, ce sont mêmes les Index qui s’en sortent le mieux du point de vue écologique ! Des portefeuilles d’actions qui ne sont pourtant pas construits avec une thématique environnementale ou durable.

Quel crédit donner aux labels ?

En fin de compte, la question n’est plus « Greenfin ou ISR ? » mais plutôt de savoir si ces labels sont un réel gage de la qualité verte des portefeuilles d’investissements. Et encore, en comparant l’intensité carbone des différents portefeuilles ESG avec les principaux indices boursiers Européens, la comparaison n’est pas glorieuse pour les fonds labellisés. Si la distinction était dure à faire entre ISR et Greenfin, elle ne semble pas plus évidente lorsque l’on ajoute les stratégies d’investissement dites « classiques » à l’équation.

Intensité carbone des portefeuilles durables (Type : Actions – Zone Euro)

Sources : L’intensité carbone de chaque fonds est extraite du rapport mensuel (« factsheet ») du fonds en question.
Concernant les 63 fonds actions ISR zone Euro, 29 communiquent mensuellement sur l’intensité carbone de leur portefeuille. Taux de couverture de 46%. 3/6 pour les fonds actions zone Euro Greenfin, 50% de taux de couverture.
Le Stoxx Sustainable ex. AGTAFA NR et le Stoxx 600 sont des indices boursiers conçus par STOXX. MSCI Europe est un indice boursier conçu par Morgan Stanley Capital International.
Calculs de l’auteur. Courbe de Gauss obtenue par la comparaison de 32 fonds et 3 Index. Moyenne intensité carbone = 171,2t CO2 / M€ CA.

Bien que la plupart des portefeuilles affichent une intensité carbone inférieure à celle de l’indice MSCI Europe, la moyenne de l’intensité carbone des 35 fonds publiant leurs données reste de 171,2t CO2/M€ CA, soit à peine 0,8% de moins que l’indice Stoxx 600, un indice qui est astreint de toute contrainte ESG ou durable dans sa construction.

De plus, seulement 34% de ces fonds font mieux que l’indice Stoxx Sustainable, un indice construit dans une optique durable et éthique (exclusion des « sin stock sectors » : alcool, armement, jeux d’argents, divertissement pour adultes,…).

Finalement, en investissant dans un fonds labellisé « vert », diminuer l’intensité carbone de ses investissements reste rare. Pire encore, cela revient – toujours en termes d’intensité carbone – à investir dans les plus grosses compagnies cotées sur les marchés boursiers. Une non-différenciation (du moins trop faible) qui pousse à affirmer une chose : il est aujourd’hui impossible de s’assurer de la qualité verte et durable d’un produit d’investissement à travers la simple labellisation de ce dernier.

Le mal est toutefois plus profond que cela. Un tour d’horizon des indicateurs d’efficacité énergétique de la finance responsable et un mapping de ses acteurs ne permet aujourd’hui de dégager ni tendance, ni impact fort. Avec moins de 50% des fonds labellisés rendant public l’intensité carbone de leurs portefeuilles labellisés, le taux de couverture reste bien trop faible pour dessiner une image représentative du marché de la finance responsable. Pleine d’ambition, cette nouvelle industrie se cherche toujours et peine à se définir. Le mouvement de l’investissement responsable étant encore à ses prémices, il est raisonnable d’espérer qu’il tend à s’affirmer dans le futur. Reste à savoir le temps que cela prendra à redéfinir cet écosystème qui est depuis toujours aux antipodes des principes durables. Néanmoins, cela passera assurément par l’harmonisation et la standardisation des évaluations ESG ainsi que par un durcissement des attentes en termes d’indicateurs de performance énergétique de ces portefeuilles « verts ».

1 Fonds intégrant les critères Environnementaux, Sociaux et de Gouvernance.

2 Investissement Socialement Responsable, par la prise en compte des critères ESG dans le processus d’investissement, label lancé en 2016.

3 Label garantissant la ‘’qualité verte des fonds’’, lancé en 2015

4 La finance responsable est une notion qui vise à concilier rentabilité financière et impact environnemental, social ou sociétal, notamment pas la prise en compte de critères extra-financiers dans le processus d’investissement.

5 Une tendance qui a été prouvée à maintes reprises, notamment en 2015 par une co-étude de la Deutsche Bank et de l’université d’Hambourg (Deutsche Bank, 2016).

6 Principes for Responsible Investment

7 Voir l’ensemble des critères ici : Critères ISR, cf. II Annexe II / Critères Greenfin

8 L’étude porte sur les fonds de type « Action », investissant dans des sociétés cotées sur les marchés Européens.

9 L’intensité est le rapport des émissions de CO2 à la production de l’entreprise. Elle est ici exprimée en T° de CO2 / M€ de CA. En d’autres termes, c’est ce que l’entreprise rejette comme CO2 pour parvenir à dégager €1M de CA.

10 Un index (ou indice) boursier est un portefeuille théorique d’actions cotées sur les marchés. Ex : le Stoxx 600 est composé de 600 des principales capitalisations boursières européennes.

Références

Deutsche Bank. (2016). ESG and financial performance: aggregated evidence from more than 2000 empirical studies [en ligne]. Deutsche Bank [Consultée le 16 Avril 2020]. Disponible ici : https://www.db.com/newsroom_news/2016/ghp/esg-and-financial-performance-aggregated-evidence-from-more-than-200-empirical-studies-en-11363.htm

Financial Times (2020). BlackRock to advise EU on green regulation for banks [en ligne]. Financial Times. [Consultée le 13 Avril 2020]. Disponible ici: https://www.ft.com/content/da821c64-b2f8-4119-afa1-fdafa9a57918

Fonds étudiés dans la section « Intensité carbone des portefeuilles durables (Type : Actions – Zone Euro) » :AMUNDI ACTIONS EUROPE ISR / AVIVA INVESTORS VALEURS EUROPE / AVIVA INVESTORS ACTIONS EURO / AVIVA SMALL & MID CAPS ISR / AVIVA ACTIONS EURO ISR / AVIVA ACTION EUROPE ISR (NOURRICIER COMPTÉ MENTIONNÉ) /LABEL EUROPE ACTIONS / AXA GÉNÉRATION EUROPE ACTIONS / DNCA INVEST BEYOND INFRASTRUCTURE & TRANSITION / INDEP ACTIONS ISR BAS CARBONE / LBPAM ACTIONS ENTREPRISES / LBPAM ISR ACTIONS FOCUS EUROPE / LBPAM ISR ACTIONS EUROPE 50 / LBPAM ISR STRATEGIE PEA 1 / LBPAM ISR STRATEGIE PEA 2 / ECHIQUIER MAJOR SRI GROWTH EUROPE / ECHIQUIER POSITIVE IMPACT EUROPE / ECHIQUIER ALPHA MAJOR ISR / ECHIQUIER AGENOR SRI MID CAP EUROPE / LYXOR MSCI EMU ESG TREND LEADERS UCITS ETF / LYXOR MSCI EUROPE ESG LEADERS UCITS ETF / MIROVA EUROPE SUSTAINABLE EQUITY FUND / MIROVA ACTIONS EUROPE / INSERTION EMPLOIS DYNAMIQUE / MIROVA EMPLOI FRANCE / MIROVA EUROPE ENVIRONMENTAL EQUITY FUND / NN EUROPEAN SUSTAINABLE EQUITY / ODDO BHF AVENIR EUROPE / ODDO BHF ALGO ETHICAL LEADERS / HSBC RIF-Europe Equity Green Transition / LBPAM ISR ACTIONS ENVIRONNEMENT / MIROVA EUROPE ENVIRONMENTAL EQUITY FUND

Factsheet utilisées : Février 2020. Les factsheet étant mises à jour chaque mois, les données relatives aux performances carbones des portefeuilles sont sujettes à évolution.

Le label ISR. (Octobre 2019). Référentiel du Label ISR [en ligne]. Le label ISR. [Consultée le 16 Avril 2020]. Disponible ici : https://www.lelabelisr.fr/wp-content/uploads/2019/10/Referentiel_LabelISR_Novembre2018-1.pdf cf. II Annexe II

Le label ISR. (Octobre 2019). Critères ESG [en ligne]. Le label ISR. [Consultée le 05 Mai 2020]. Disponible ici : https://www.lelabelisr.fr/anstyq/criteres-esg/

Ministère de la Transition écologique et Solidaire. (2020). Le label Greenfin [en ligne]. Ministère de la Transition écologique et solidaire. [Consultée le 16 Avril 2020]. Disponible ici : https://www.ecologique-solidaire.gouv.fr/label-greenfin

MSCI (2020). MSCI Europe Index [en ligne]. MSCI. [Consultée le 16 Avril 2020]. Disponible ici : https://www.msci.com/documents/10199/db217f4c-cc8c-4e21-9fac-60eb6a47faf0

MSCI (2020). What is ESG [en ligne]. MSCI. [Consultée le 05 Mai 2020]. Disponible ici : https://www.msci.com/what-is-esg

Option Finance (2020). La pertinence des critères ESG, pour un investissement responsable et durable [en ligne]. Option Finance. [Consultée le 05 Mai 2020]. Disponible ici : https://www.optionfinance.fr/blogs-analyses/lanalyse-de-christine-jeanclos/la-pertinence-des-criteres-esg-pour-un-investissement-responsable-et-durable.html

Robeco (2020). Glossaire de l’investissement durable [en ligne]. Robeco. [Consultée le 05 Mai 2020]. Disponible ici : https://www.robeco.com/fr/nos-points-forts/investissement-durable/glossaire/definition-del-esg.html

STOXX. (2020). EURO STOXX® Sustainability ex Alcohol Gambling Tobacco Armaments & Firearms Adult Entertainment [en ligne]. STOXX [Consultée le 16 Avril 2020]. Disponible ici : https://www.stoxx.com/index-details?symbol=SUYE

STOXX. (2020). STOXX® Europe 600 [en ligne]. STOXX [Consultée le 16 Avril 2020]. Disponible ici : https://www.stoxx.com/index-details?symbol=SXXP

The Guardian (2019). Wall Street investment giants voting against key climate resolutions [en ligne]. The Guardian. [Consultée le 04 Mai 2020]. Disponible ici: https://www.theguardian.com/environment/2019/sep/17/wall-street-asset-management-climate-change-blackrock-vanguard

UNPRI. (2019). About the PRI | Signatory growth [Tableau Excel]. UNPRI. [Mars 2019]. Disponible ici: https://www.unpri.org/pri/about-the-pri

Capture Carbon: a way to reach Net Zero by 2050 ?

Par Fanny Burger, Clémence Sutter, Yasmine El Ansari, Alessio Vitale, Baptiste Joie, Alexis Furstenberger, William Schmitt, Yann Keshvary-Rad, étudiants ESTA Belfort, 05/2022

Mots clés : #Greenhouse gas #Net Zero #carbon capture #storage #CO2 emissions

“The world has a huge challenge ahead of it to move net zero by 2050 from a narrow possibility to a practical reality!”

July 29th 2021 = «Overshoot Day»

It means that humanity has spent all the resources that the Earth can regenerate in one year.

Calculated by ONG Global Footprint Network, this date is based on three million statistical data from 200 countries.

This is the date from which the ecological footprint exceeds the planet’s biocapacity. It also marks the moment when our greenhouse gas emissions from burning fossil fuels will be more important/ significant than our oceans and forests can absorb.

Currently, we use 74% more than the planet’s ecosystems can regenerate which is equivalent to the resources that 1,7 Earths would produce!

How to postpone this date? By using the exact amount of energy, the earth can produce and by limiting CO2 emissions with the aim of carbon neutrality. Net Zero is our chance for a sustainable future.

What is Net Zero?

Net zero refers to a state in which the greenhouse gases going into the atmosphere are balanced by removal out of the atmosphere.  Net Zero means that for every molecule of Greenhouse gas we put into the air we also take one out making our net emissions zero.

Figure 1 : illustration of Net Zero’s balance

We reach net zero when the amount we add is no more than the amount taken away.

Net ZERO as the goal

Net zero is important as it’s the best way we can tackle climate change by reducing global warming. With action on reducing all other sources of GHG (greenhouse gas) emissions, achieving net‐zero CO2 emissions from the energy sector by 2050 is consistent with around a 50% chance of limiting the long‐ term average global temperature rises to 1.5°C without a temperature overshoot!

Net Zero requires making big changes today, use less or more efficiently. Even bigger technological changes like replacing all greenhouse gas emitting activities with clean ones.

Moreover, the number of countries that have pledged to reach net-zero emissions by mid-century (or soon) continues to grow. By the end of 2021, over 80 countries, representing almost 75% of global emissions, announced commitments to achieve net-zero emissions. That’s motivating and it helps people, industries and government to keep continuing in that way.

To reach Net Zero we have to do a total transformation of the energy system, COP26 focused the fact that we need to strengthen global ambitions and actions on climate by building on the foundations of the 2015 Paris Agreement.

How can we reach it?

IEA made a Roadmap focusing on a pathway the most feasible, cost-effective and socially acceptable. Their Roadmap is global in scope, but each country will need to design its own strategy.

Technology deployment, the need of innovation

Between 2030 and 2050 there is also a question of the rapid deployment of existing technologies but also of solutions that are not yet operational. We need to use the actual technologies and in parallel develop new solutions. Indeed, in the IEA’s projections for achieving neutrality, nearly half of the expected emissions reductions in 2050 are enabled by technologies at the prototype stage. This is particularly the case for heavy industry and long-distance transport. The biggest opportunities for innovation highlighted by the IEA are next-generation batteries, electrolytic hydrogen, and direct air capture and storage.

Increasing of renewable energy

Regarding the increase in the use of renewable energies, the 2020-2030 decade is marked by an expansion of renewable energies with some striking figures: +630 GW of additional solar photovoltaic in 2030 and +960 GW for wind power (four times more than the level of 2020, which is already a record), still relying on hydroelectric and nuclear power plants, which for the IEA are an essential foundation for this transition.

The IEA projects that by 2050, two-thirds of the world’s energy supply will come from renewables (solar, wind, hydro, bioenergy, geothermal). Solar energy would be the dominant source, with a capacity that would be multiplied by 20 compared to the current level. Fossil sources would be restricted to a few uses (carbon capture facilities, plastics, sectors with limited low-carbon technologies).

The absolute priority is to generate decarbonized electricity as soon as possible to electrify entire sectors of the economy, such as transportation. Indeed, this scenario sees the share of electric vehicles in global sales increase from the current 5% to over 60% in 2030.

Vast amount of investment & international co-operation

In order to respect a trajectory compatible with the 2050 neutrality objective, the IEA recommends a sevenfold increase in annual investments in clean energy in emerging and developing countries.

These are standards that must be put in place, otherwise CO2 emissions from energy-related economies will increase by nearly 5 Mds t CO2 in Asia, Africa and South America over the next two decades.

Financing the investment

Financing the investments needed to achieve Net Zero Emissions by 2050 would involve redirecting existing capital to clean energy technologies and also increasing the overall level of investment in energy.

It costs twice as much to avoid one ton of CO2 emissions in developing countries as in advanced economies because there is much less to dispose of. This explains the fact that it is possible to switch to more efficient technologies in these countries as there will not necessarily be emitting facilities already in place.

How is it financed?

Most of this increased investment is coming from private sources.

These are mobilized by public policies that reform energy taxes.

However, direct public funding is necessary to stimulate the development of new infrastructure projects and accelerate innovation in technologies (currently in the demonstration or prototype phase).

For the developing economies and emerging markets, projects are often relatively reliant on public financing.

International co-operation

In order to facilitate international capital flows, many countries have made efforts to cooperate with each other and are committed to the goal of net zero by 2050.

People behavior

The transition to net zero is for and about people. 5% of the emissions reduction will be due to behavior change. Citizens must be active participants in the entire process, they need to be part of the transition. It’s not that easy to do that big change so governments need to promote training and devote resources to facilitating new opportunities.

Decarbonization’s milestones

Here are some clear milestones for what needs to happen and when, to transform the global economy from one dominated by fossil fuels into one powered predominantly by renewable energy.

Every country, sector, industry and each one of us must work together to find ways to cut the carbon we produce.

Capture Carbon

Growing interest in Direct Air Capture for Net Zero

Direct Air Capture (DAC) is a technology for capturing CO2 from the air and from the atmosphere. This technology could be very useful to contribute to climate change and some countries, companies and investors have decided to support Direct Air Capture. The goal with the Net Zero Scenario is to reach around 980 MtCO2 (million Tonnes of carbon dioxide) in 2050. The term “net” refers to balancing any CO2 that is released into the atmosphere from human activity with an equivalent amount being removed.

To capture the CO2, we need to have facilities and across the world there are 18 plants operating especially for DAC. These plants are mainly based in the USA, Canada and Europe.

There are some companies which are supporting and leading the development of the DAC technologies, in particular the Swiss company called Climeworks AG. In fact, this company has commissioned 15 of the 18 plants.

It’s not alone as other smaller companies are also involved in the commercialization of DAC technologies such as Carbon Engineering Ltd and Global Thermostat.

After capturing the CO2 from the air, we have 2 possibilities: we can store it and we can use it to produce different types of products such as for the synthetic aviation fuels, food and beverages. Most of these 18 plants are very small and are specializing in DAC for use. There are only two plants in Iceland which are capturing CO2 from atmosphere and to blend it with CO2 from geothermal fluids to store it underground and to form rocks. So, they are turning CO2 into rocks through mineralization. Currently, one of this plant is the biggest for DAC thanks to its expansion in 2021. They can capture approximately 4000 tCO2 per year.

As we can see on the graphic just below, in the Net Zero Scenario in 2050, we essentially want to store the CO2 rather than for using. To remind, the goal is to capture almost 1000 MtCO2 so the storage will represent approximately the 2/3 of the DAC. We need to build new plants like in Iceland which are specializing in the underground storage of CO2.

Direct Air Capture is part of the Net Zero Scenario but there is another solution to capture the CO2 which is the Biomass also called BECCS.

As we can see on the graphic below, in 2050 in the Net Zero Scenario, we want to improve and equilibrate the capture of CO2 from DAC and Biomass.

Technologies to capture CO2 from the air

Solid and liquid direct air capture:

Two technology approaches are presently being used to capture CO2 from the air solid and liquid DAC.

Solid DAC uses a solid filter that reacts chemically with CO2. When the filter is heated, it releases the CO2 which can be stored or used.

Liquid DAC first passes the air through a chemical solution removing the CO2 and returns the air to the outside and then the CO2 is extracted from the solution by heating.

Emerging direct air capture technologies:

Emerging DAC technologies include electro-swing adsorption (ESA) and membrane-based DAC (m-DAC).

ESA is based on an electrode that absorbs CO2 when the charge is negative and releases it when it is positive. This method allows CO2 to be separated from both air and more concentrated sources. The technology has been tested with an efficiency of 90% but further work is required to commercialize it.

m-DAC requires a high pressure for the membrane to separate CO2 from the ambient air due to its low concentration.

Current capture costs via DAC are high and uncertain:

Capturing CO2 from the air is more expensive than capturing it directly at the source because of the concentration. The more diluted the CO2, the higher the energy cost.

Costs also vary according to the type of liquid or solid technology. Once captured, the CO2 must be either geologically stored or used immediately at low pressure. For storage, the CO2 must be compressed and injected into geological formations.

According to IEA estimates, the cost of large-scale capture (1MtCO2/year) would be USD 125-335/tCO2 depending on the technology, energy price, configuration etc. If the price reaches USD 160/tCO2, carbon capture could become profitable.

The potential for reductions in the cost of direct air capture is considerable:

DAC technology has considerable potential for performance and cost reduction. The goal is to bring the cost per tonne captured down to around USD 100 over the next decade.

Key considerations for direct air capture deployment

To reach the Net Zero Scenario goals which are significant but not impossible for the DAC development, we need to build each year a lot of new DAC plants.

Here, is the plant construction program we need to meet to reach the final goal in 2050:

From now to 2030: construction of 8 large-scale DAC plants each year

From 2030 to 2040: construction of 50 plants each year

From 2040 to 2050: construction of 40 plants each year

All these constructions are necessary to obtain the 980 MtCO2 of CO2 capture. Obviously, with these constructions, we need to expand the global supply chains for different products.

These plants will also need a lot of energy per year to capture almost 1 GtCO2. For comparison, the energy needs will be equivalent to all the energy the Netherlands has exported in 2019, that’s huge.

Here are all the energy needs for the different capture of CO2. For example, we can see that Liquid Direct Air Capture, whether for storage or for use, need less energy than Solid Direct Air Capture.

However, S-DAC plants can use some renewable energy sources for example heat pumps, solar thermal and geothermal to work.

Currently L-DAC can’t work with renewable energy because plants need high temperatures and renewable energy is not enough to have high temperatures. 

In addition to energy, Direct Air Capture plants need a lot of water to capture CO2. Especially Liquid DAC requires a lot of water for its operation. Solid DAC doesn’t need water because depending on conditions it can extract water from the air.

Optimal locations for direct air capture

One of the main advantages of the direct air capture is that a factory can be located almost anywhere, for instance near a suitable storehouse point for carbon junking, or a manufactured complex seeking a force of atmospheric (rather than reactionary) CO2 feedstock, lowering the need for long- distance CO2 transport.

However, despite these sitting facilities this technology still has some limitations. Indeed, for now DAC plants have been tested in Europe and North America but it still needs further testing for climate that are either extremely dry or humid and even high polluted climate.

Moreover, the choice of location needs to take in account the energy source available there, indeed this will greatly affect the efficiency of the capture.

Capture cost by location :

As said before the DAC has been tested mainly in Europe and North America because these regions have the potential for co-siting with existing industrial hubs as well as existing and planned CO2 transport and storage infrastructure.

To be cost-competitive a region needs to have either a very high renewable energy potential, low natural gas prices, or a strong interest in CO2 use and the carbon circular economy.

Different countries have some of these characteristics (North Africa, the Middle East, Russia Federation, Japan).

Energy sources :

When a region is characterized by high renewable eventuality, the assessment of its suitability for substantial DAC deployment should take into regard several additional factors related to land use and land use change (the degree of urbanization, the presence of natural Territories and ecosystems, and marine defended areas).

Other sources of energy that could be used to power DAC include nuclear,geothermal and hydropower factories. Utmost, numerous hydropower factories are located across South America, Eastern Europe and southern China, while geothermal plants are located along the west seacoast of the United States and Mexico, and in Japan and the Philippines. Meanwhile, nuclear plants are substantially located in the eastern United States, Europe (especially in France), along the east seacoast of China and in Japan for the moment but several reactors are being decommissioned.

Use and storage of air-captured CO2 :

Once CO2 has been captured from the atmosphere it can either be stored underground or be used directly or indirectly. For now, out of the 18 DAC only 2 of them are storing CO2.

However, in the IEA Net Zero Emissions Scenario, 95% of the total CO2 captured should be stored rather than used. Of the 980 MtCO2 captured via DAC in 2050, 630 MtCO2 is permanently stored while 350 MtCO2 is for CO2 use (mainly for aviation fuels).

There are different ways to stock the CO2 captured through DAC, it can be stored geologically in deep saline aquifers (having the largest storage capacity), in depleted oil and gas fields, and in other rock formations such as basalt.

Direct air capture as part of a carbon dioxide removal portfolio

What is carbon dioxide removal? 

CDR (carbon dioxide removal) is a term that refers to approaches that draw CO2 from the atmosphere, directly or indirectly, and permanently store it. Removing carbon from the atmosphere will play an important role in meeting climate goals especially as it can help reduce or balance CO2 emissions in sectors hard to reduce (because they are either too costly or because it is technically too difficult).

It can also help reaching enable “net negative” emissions at a global scale. Thus, it can remove historical emissions that have accumulated in the atmosphere.

To limit the future temperature increases to 1.5°C all existing IPCC models includes CDR deployment and most of them includes net negative emissions in the second half of the century.

What are the main carbon dioxide removal options?

The range of carbon removal approaches includes nature-based and technology-based options, and options that enhance a naturally occurring process. They remove CO2 either directly from the air (DAC) or indirectly (biomass growing) and store the CO2 either geologically, within the terrestrial biosphere (within soils, minerals or biomass), or in the ocean.

Scaling up the deployment of direct air capture

Support for direct air capture

Growing recognition of DAC technologies’ important role in meeting net zero goals is translating into increased policy support and investment. Since the start of 2020, almost USD 4 billion in funding has been announced specifically for DAC research, development and deployment (RD&D), while leading DAC companies have raised around USD 125 million in capital.

Plans for nine DAC facilities are now in development. If all of these planned projects were to go ahead, DAC deployment would reach around 3 MtCO2 by 2030; this is more than 380 times today’s capture rate, but a mere 3.4% of the level of deployment needed in the Net Zero Scenario.

Business models for direct air capture :

There are two primary commercial drivers for investing in DAC technologies:

1) selling high-quality carbon removal services when DAC is combined with CO2 storage

2) selling climate-neutral CO2 as a feedstock for a range of products, including aviation fuels and beverage carbonation.

DAC companies are offering commercial removal services to individuals as well as companies willing to pay a recurring subscription to have CO2 removed from the atmosphere and stored underground on their behalf. The price of the subscription varies (depending on the amount of removal purchased) from USD 600/tCO2 to USD 1 000/tCO2, although price details for the larger commercial deals are not available.

Selling the CO2 for use in industrial applications:

Most DAC facilities currently in operation generate revenue from selling the captured CO2. While the largest industrial uses of CO2 today are in fertilizer production and enhanced oil recovery, future large-scale opportunities to use CO2 include the production of chemicals, fuels and building materials.

Six priorities for direct air capture deployment :

Références

Data and statistics. (2020). Iea. Https://www.iea.org/data-and-statistics

Iea publications. (2021, octobre). Net zero by 2050 a roadmap for the global energy sector. International energy agency. Https://iea.li/nzeroadmap

Iea publications. (2022, avril). Direct air capture a key technology for net zero. International energy agency. Https://www.iea.org

Net zéro : l’aie propose une feuille de route mondiale pour la décarbonisation du secteur de l’énergie. (2021). Https://www.citepa.org/fr/2021_06_a07/.

What is net zero and what does it mean? (2020). https://www.twi-global.com/technical-knowledge/faqs/what-is-net-zero

Carbon neutrality, which scenarios for France in 2050?

Par Emile Poncelet, Esteban Leleu, Victor Rosenbaum, Julien Messner, Louis Noyer, Lyes Selmouni, Lucas Maitrugue, étudiants ESTA Belfort, 05/2022

Mots clés : #Carbonneutrality #Climate #EcologicalTransition #Energy #Greenhousegaseffects

What’s carbon neutrality and how to reach it?

Carbon neutrality refers to a balance between carbon emissions and carbon absorption from the atmosphere in carbon sinks. Carbon sequestration is the process of removing carbon dioxide from the atmosphere and storing it. All global greenhouse gas (GHG) emissions must be offset by carbon sequestration in order to attain net zero emissions.

Forest fires, changes in land use, and logging all release carbon from natural sinks like forests into the atmosphere. To achieve climate neutrality, it is therefore critical to minimize carbon emissions.

Another strategy to cut emissions and achieve carbon neutrality is to reduce emissions in one sector by lowering emissions in another. This may be accomplished by putting money into renewable energy, energy efficiency, and other low-carbon technology. An example of a carbon offsetting mechanism is the EU’s emissions trading system (ETS). The carbon border adjustment system, which would impose carbon pricing on imported goods from nations with lower climate ambitions, is one example of an approach to cut emissions. This should deter corporations from shifting manufacturing out of the EU to a country with less rigorous greenhouse gas emission regulations. In 2021, the Commission should propose this carbon tax.

What are the goals?

The European Union is working on an ambitious climate policy. As part of the Green Deal, we want to be the first continent to reduce CO2 emissions generated by 2050.

In April 2021, the MEP agreed with the Council on the EU’s commitment to be carbon-neutral by 2050.

Currently, five EU countries have set climate-neutral goals by law. As Sweden wants to achieve net zero emissions by 2045, France wants to achieve carbon neutrality by 2050.

ADEME’s carbon neutrality scenarios for 2050

ADEME (Agence de l’Environnement et de la Maîtrise de l’Energie) is a French public establishment of an industrial and commercial nature, founded in 1991 and placed under the supervision of the Ministries of Ecology, Sustainable Development and Energy and of Higher Education and Research. Its mission is to help implement public environmental and energy policies.

ADEME wished to submit to the debate four coherent « typical » paths that present, in a deliberately contrasting manner, economic, technical, and social options for achieving carbon neutrality in 2050. They are based on the same macroeconomic, demographic and climate change data (+2.1°C in 2100). However, they take different paths and correspond to different societal choices. In this article, we are mainly focusing on two of the four scenarios.

First scenario “Frugal Generation”

This first scenario consists of doing several changes in our way of living, especially travelling, heating up our homes, eat, buying and using equipment. Those changes will allow us to reach carbon neutrality without the implication of capture and/or storage of carbon technologies which are mostly unproven and uncertain on a large scale.

The scenario is the following:

New consumers’ expectations as well as new practices will appear in our ways of consuming. The growth of energy demand which takes all the resources and deteriorates the environment will stop thanks to evolution in our behaviour, organisation, and technology. The transition will mainly be powered by frugality thanks to sobriety and strain.

Respect of nature and adaptation to climate change

The whole idea revolves around the fact that nature is an entity considered as a sanctuary and that we as humans belong this sanctuary.

As an efficient way to adapt ourselves, part of the production system is based on low-tech (as opposed to high-tech) and small and medium-sized enterprises: technical systems and technologies, simplified and made more robust, are more controllable and repairable by citizens: thus, the sobriety of products and services makes it possible to better absorb direct climatic hazards or their socio-economic impacts. In other words, this is the end of planned obsolescence and overconsumption.

Bioeconomy, food, agriculture, forest and soils

There’s an in-depth transformation of our eating habits as well as reasonable management of the forest resources.

The evolution of farming systems (70% of production at very low input levels) follows that of diets, i.e., a threefold reduction in the quantity of meat with more extensive but fewer livestock. The consumption of exotic products is reduced.

The surface occupied by non-productive natural areas is thus significantly increased. The impact on ecosystems is reduced. Apart from food, methane and combustion are two important ways of using biomass, which is mainly agricultural. Sobriety in the use of wood materials (sawing, panels and buildings) makes it possible to satisfy needs with a collection of wood in the forest that has remained constant.

Development of land-buildings-mobility

On this point, the main objective is to massively reduce the number of new constructions and to favour the renovation of buildings.

In order to reduce the number of new buildings, the number of people per dwelling should be increased to 2.1, compared to 2 at present, and the number of second homes should be divided by 3. The main consequence of this is the reduction of building materials and the reduction of GHG emissions. Rural areas and medium-sized towns are favoured over large cities and metropolitan area.

Natural resources are now preferred; wood heating is developing, and the use of gas is decreasing.

Finally, we note that daily life in housing is evolving at a high speed. A decrease in the rate of equipment is to be expected as well as a mutualisation of the various household appliances.

This will result in electricity consumption for certain uses (household appliances, electronics, lighting) being divided by three by 2050.

Industry, materials and circular economy

A restrained industrial production with a significant focus on the “Made in France”. Material demand is decreasing significantly, in line with major changes in lifestyles: a 30% reduction in the surface area of new single-family homes compared to nowadays, a halving of the number of cars produced, a 70% reduction in the consumption of synthetic fertilisers per inhabitant, etc.

As a result, industrial production is declining in physical volume and activity is being transferred to other sectors. The production of certain sectors is relocated. The production system decarbonises mainly via biomass, to reach -53% of energy consumption and -79% of GHG emissions in 2050.

Decarbonised energy systems

Concerning the decarbonization of our energy systems,

Limit construction, implementing rapid and energetic renovations, pooling equipment at the scale of the living areas. These measures allow to divide by 3 the consumption of electricity

for specific uses (household appliances, electronics, lighting, etc.). If possible, the mitigation of a decrease in demand of mobility, increased proximity, increased carpooling as well as modernization of hitchhiking in rural areas, promote walking, cycling and public transport.

45% decrease in national freight traffic.

Moreover, as said before, promote the made in France, consuming locally and relocating our production sites would be essential and not negligible points to decarbonize our systems.

GHG and carbon sinks

Wood harvests are stable and only biological sinks (soil, forest, biomass) are mobilised. These are much more developed than they are today (80 MtCO²eq per year in the forest alone, 116 MtCO²eq in total, compared to 44 MtCO²eq of total natural net sink today), with modified agricultural practices and a significant growth of the forest maintained in extensive management.

The philosophy of this scenario is based on the sanctity of organisms and the reduction of consumption, which can be done without a technology sink, or even with a positive hedge in case of a negative impact on climate change. The net emissions balance is -42MtCO₂eq.

Second scenario “Regional Cooperation”

Within the context of shared governance and regional cooperation, society is altered. Non-governmental organizations, government institutions, the corporate sector, and civil society work together to keep the social fabric intact. To achieve this carbon neutrality, we will have to count on a sustainable path used by our society, mixing sobriety efficiency.

Adaptation to climate change

The climate change adaptation strategy is based on balanced governance at the national and regional levels: the national level coordinates and pools needs for investment in climate change adaptation from regional population centre and plans strategic resource stocks, whereas the regional or even sub-regional level continuously monitors natural resource pressure to adjust public and industry sector policies.

Ecological engineering approaches are being developed: ecosystem services are being incorporated into all infrastructure building and maintenance programs, and cities are becoming more ecologically oriented. Citizens are constructing ecological corridors by greening public and private locations. They are planning to adapt to climatic shocks as a group.

Bioeconomy-food-agriculture, forest-soils

The climate change adaptation strategy is based on balanced governance at the national and regional levels: the national level coordinates and pools needs for investment in climate change adaptation from regional population centers and plans strategic resource stocks, whereas the regional or even sub-regional level continuously monitors natural resource pressure to adjust public and industry sector policies.

Ecological engineering approaches are being developed: ecosystem services are being incorporated into all infrastructure building and maintenance programs, and cities are becoming more ecologically oriented. Citizens are constructing ecological corridors by greening public and private locations. They are planning to adapt to climatic shocks as a group.

Development of land-buildings-mobility

The climate change adaptation strategy is based on balanced governance at the national and regional levels: the national level coordinates and pools needs for investment in climate change adaptation from regional population centers and plans strategic resource stocks, whereas the regional or even sub-regional level continuously monitors natural resource pressure to adjust public and industry sector policies.

Ecological engineering approaches are being developed: ecosystem services are being incorporated into all infrastructure building and maintenance programs, and cities are becoming more ecologically oriented. Citizens are constructing ecological corridors by greening public and private locations. They are planning to adapt to climatic shocks as a group.

With the emergence of daily trains, freight cycles, folding bikes, velomobiles, mini-cars, carpooling, and huge electrification, demand for transportation is transitioning to a more local approach, supported by substantial targeted investments. As a result, automobile externalities are reduced (environmental impacts, congestion, sedentary lifestyles, etc.). Due to a fall in quantities and distances traversed, freight traffic is down 35% in ton-miles, with the proportion of rail and waterways more than tripling. Filling and efficiency optimization also decreases energy usage, which is becoming more diverse and adaptable to local resources. As a result, direct GHG emissions from the mobility sector have decreased by 95%.

Industry-materials-circular economy

A low-carbon industrial policy that promotes higher energy and material efficiency, regional specialization, and a circular economy is supported and funded by public planning. Recycling is well-developed, yet the overall amount of waste to be recycled has decreased as a result of the circular economy’s success. The need for recovered raw materials and energy, on the other hand, finds a happy medium, resulting in a high recovery rate (95%) and the virtual absence of landfills. In addition, in specific areas where manufacturing is decarbonised, a massive re-industrialisation effort (enhancing trade balances in terms of physical quantities) is underway. Nonetheless, owing to changes in demand, physical volume production in most areas decreases. In 2050, industry achieves a 47% decrease in energy usage and an 84% reduction in GHG emissions.

Decarbonised energy systems

This goal may be achieved using 3 mains energies. First, we would have to maintain our electricity at least as it is nowadays, in term of production per capita. Then, the hydrogen industry will have to evolve at until we could use it for some direct and indirect uses in society. Finally, our common gas consummation degreases as our demands of decarbonate gases increase.

GHG and carbon sinks

Carbon storage in soils due to favourable agricultural practices. Moderate levels of wood harvesting in forests, allowing the maintenance of a significant carbon sink in forestsCO2 capture and storage is deployed on a few processes with incompressible emissions (cement plants).

Conclusion

Those scenarios as different as they are each have their lot of limitations including some in commons such as the lack of benchmarks for various sectors that are not as mainstreams nowadays. Also, some scenarios have more scientific evidence backing up but as they juxtaposed it may seem that they are as likely to doable. Another point that wasn’t considered in the ADEME analysis is biodiversity as it’s not included in the report.

To conclude, the transition to carbon neutrality is far from easy but mandatory. As we saw there are several scenarios possible to reach this milestone, each of them has a different approach on the subject but in the end the objective is the same, preserve the environment and make life easier and durable. If you want to know more about the other scenarios, we suggest visiting « the other ADEME group’s article” (link in the sources).

Références

Ademe website. (2022). https://www.ademe.fr/ https://transitions2050.ademe.fr/en

What is carbon neutrality and how can it be achieved by 2050? | News | European Parliament. (2021, 24 Juin). European Parliament. https://www.europarl.europa.eu/news/en/headlines/society/20190926STO62270/what-is-carbon-neutrality-and-how-can-it-be-achieved-by-2050

Ademe. (2015). Transition 2050 decide now act4 climate, https://librairie.ademe.fr/cadic/6739/transitions-2050-synthesis.pdf?modal=false

Climate Urgency: The race to 2050

Par Benjamin Bringard, Hatsuné Yoshikawa, Tidiane Ba, Elhadji Diop, Nathan Avis, Yamina Abdallah, Emile Maurer, étudiants ESTA Belfort, 05/2022

Mots clés : #Green Energy #Climate #Carbon Neutrality #2050 #Electricity #Sustainable development #Nuclear

Horizon 2050, how to reach our environmental goal ?

Nowadays, our planet is going through constant changes which might bring lasting damages. In order to avoid various disasters, we need to change our current lifestyle and our abusive consumption habits. All the science makes clear that urgent action is vital for us and the planet. One of the major changes that the world needs to make concerns the way we produce our energy. To do so, the French company RTE, or Electrical Transportation Network in English, has published a study detailing various measures that can be taken in order to meet the ecological objectives that the French electricity network needs to meet by 2050. In this article, we will discuss these measures and how they will impact both the population and the ecology.

Goal 2050: A new network

Our current energy creation, on a global scale, still relies heavily on CO2 generating resources, mainly fossil fuels such as coal or oil. However, it has become clear from recent scientific studies that it is necessary to get rid of almost all of them if we want to avoid an ecological catastrophe by 2050. As such, it has become necessary for all countries to rework their methods and their electrical networks.

The French electricity network is one of the most advanced with respect to the current ecological objectives. This is mainly due to the large presence of nuclear power currently in place, which provides about 20% of the country’s annual electricity consumption, while another 20% comes from non-carbon sources. This means, however, that nearly 60% of the energy consumed today in France is produced using fossil resources. This is far too much for what we need to achieve by 2050, with the goal of almost completely replacing these fossil fuels. 

Figure 1: Energy consumption by source in France nowadays.
Source: https://commons.wikimedia.org/wiki/File:Energy_mix_in_France.svg

However, this is not the only thing that needs to change with respect to French electricity consumption. Indeed, energy consumption must also be reduced, by an estimated 30 to 40%. Although many scenarios can be conceived to reach the ecological objectives of our new network, each with its challenges and constraints, it remains clear that the French network will mainly go in one of two main directions, whose issues we will explain as well as possible.

The RTE study proposes 6 scenarios to address these issues. They all represent our energy objectives achieved by different means, prioritizing different types of energy, whether offshore wind or not, solar or nuclear. Without going into the details of the exact amounts of energy estimated for each method, these scenarios can be studied in two major directions, renewable energy without nuclear or with nuclear.

Renewable energy development

The almost exclusive use of renewable energies such as wind, solar and hydraulic energy to produce electricity for our future network is the first major direction proposed by RTE. This idea may seem ideal, given that the production of these energies does not pose any major danger, either environmental or human. However, this solution implies many issues that need to be carefully considered, such as the increasing strategic importance of the metals needed to build these tools, or the flexibility needed for such a network.

Indeed, solar and wind energy production methods have the disadvantage of being dependent on environmental conditions. A wind turbine cannot produce electricity if the wind is not blowing, and a solar panel will have no effect at night or in heavy rain. As the share of electricity in our grid produced by these methods grows, so will the need for alternative means of generation, such as power plants that are capable of producing the electricity that might abruptly run out at any time.

However, this is not the only major constraint associated with this idea. Such a network, dependent on many production units spread across the country, would imply a highly developed maintenance infrastructure, in order to ensure that solar panels are clean, wind turbines do not have problems and other circumstances. This contributes greatly to the estimated cost of this scenario by several billion each year, making it very costly, although still feasible. The installation of elements such as offshore wind turbines also implies constraints to maritime activities such as fishing, causing possible conflicts of interest.

Other possible problems are not as significant as one might think. The area covered by these installations, for example, is much more negligible than most might say. Indeed, even if we were to achieve the goal of full renewable energy by 2050, the installations would only cover a maximum of 0.3% of the surface of France, or about 30,000 hectares. This might seem like a lot, but the current highways alone cover nearly one million hectares. There is a strong contrast in France between the visual impact of the current power grid and greener energies. Where the few power plants and dams currently in use in France are discreet, wind turbines and solar panels are much closer and visible, creating a strong impression, even though their actual presence is negligible. In the same way, the problem of the limited use of these lands can be mitigated by cohabitation. For example, it is possible to farm around wind turbines.

A simple example of the heavy quantity of transformations needed is the number of charging sites needed in the coming years, compared to what we have today.

Figure 2: Percentage of charging sites 2030 needs in place through 2020.
Source: https://www.automotiveworld.com/news-releases/icct-charging-infrastructure-to-support-the-electric-mobility-transition-%E2%80%AFin-france%E2%80%AF/

These transformations in the electrical grid will also pose challenges with respect to grid vulnerability. Between climate change, the intensity of which will depend on our efficiency, and changes in our production, we will have to take different situations into account. Where today’s grid is vulnerable to large temperature changes, tomorrow’s grid will be vulnerable to windless periods. All these elements might seem catastrophic, but they are really just different issues that need to be taken into account and anticipated. It is not possible to design a perfect scenario, but it is possible to design adequate scenarios. The RTE study also reflects on the place of nuclear power in our future network, and how it could reduce the intensity of the problems mentioned above, although it poses its own problems.

Nuclear energy

A scenario where the energy transition is 100% to renewable energies would indeed achieve the environmental objectives set for 2050. However, this scenario is particularly expensive and poses many logistical challenges that are difficult to anticipate effectively. However, our current grid already has a significant amount of nuclear power, which is the result of an energy independence plan from the 1980s. This strong base could reduce the impact of solar and wind power depending on where it is placed. 

Figure 3: Number of nuclear reactors in operation and capacity by age worldwide.
Source: https://www.iaea.org/newscenter/news/iaea-releases-2019-data-on-nuclear-power-plants-operating-experience

An important issue in this idea is that it is not often mentioned. Indeed, the current reactors are now about 40 years old. However, it is difficult and expensive to extend the life of a nuclear reactor beyond 50 years. It is generally believed that 60 years is a limit that should not be exceeded. This creates an important problem: The majority of the French nuclear fleet will have to be replaced by 2050. This means that simply maintaining it at its current state is a problem to be considered, with its costs and decisions to be made.

These decisions must be made as soon as possible, because the creation of a nuclear reactor takes several years. Thus, if France decides to create a new power plant today, it will not be operational before at least 2035. Because of this renewal, and the times involved, it is impossible to depend solely on nuclear power to achieve our ecological goals: it can only act as a support for a renewable energy network. The question that needs to be asked is how much nuclear power we want to keep in our 2050 grid. Nuclear power, while it has its own risks and consequences, such as radioactive waste or the risk of explosions, has the merit of requiring very little flexibility, covering one of the biggest problems of the previous idea. Even with the costs associated with the creation of new reactors and the maintenance of the previous ones, the estimated cost remains lower than that of a purely renewable grid. However, the danger of nuclear power plants cannot be underestimated.

Although technological advances may reduce these elements, it is impossible to neglect the risks based on possible advances. In economic terms, the integration of a significant amount of nuclear energy into this future grid would remain consistent in almost all situations, even in the case of almost no progress on cost reduction, which would normally occur naturally in the course of technology progression. It would also make the pace of implementation of renewable energy methods much more sustainable. Indeed, without nuclear power, the pace of implementation would have to exceed even that of the most dynamic countries in order to reach our carbon targets. It would therefore seem more realistic to maintain a certain amount of nuclear power, although the previous plan remains possible.

Urgency of the situation

No matter which solution France chooses to use, environmental measures must be implemented as soon as possible. All the studies and solutions chosen show us that action must be taken immediately. Putting France in a direction that would lead it towards decarbonization is therefore the first step to take. France but also the whole world must start to modify little by little all the sectors of activity to make them « green » and decarbonized. Another challenge we have to face is energy efficiency and its use. France is going to have to get used to consuming less electricity and especially to using it better. Whether it is in large measures like the solutions we mentioned in the article or in smaller measures. Whether it’s on a city scale with actions such as turning off street lights or making better use of all the city’s water systems. Or on the scale of the citizen who will reduce his own energy consumption. All these actions may seem insignificant but it is now that the changes must be made whether it is for a man or for a company like RTE. 

Références

RTE (2021) Energy Pathways to 2050. Retrieved from: https://assets.rte-france.com/prod/public/2022-01/Energy%20pathways%202050_Key%20results.pdf?fbclid=IwAR3dzJWcx2P8F5jRRvUwloGxOf_gWPC6PyuvTvp2IPobArxfkaR4n7RL84M

Pamela Largue (2020) It’s all about flexibility. Retrieved from: https://www.smart-energy.com/renewable-energy/renewable-energy-integration-its-all-about-flexibility/

Anmar Frangoul (2021) France’s love affair with nuclear power will continue, but change is afoot. Retrieved from: https://www.cnbc.com/2021/03/10/frances-love-affair-with-nuclear-power-will-continue-but-change-is-afoot-.html

Energy.gov, Advantages and Challenges of Wind Energy, Retrieved from: https://www.energy.gov/eere/wind/advantages-and-challenges-wind-energy

Lora Shinn (2018) Renewable Energy: The Clean Facts. Retrieved from: https://www.nrdc.org/stories/renewable-energy-clean-facts

2050 projection: the gradual withdrawal from fossil fuels in favour of eco-transition 

Par Joyce Andriamahazosoa, Hugo Lebatard Puget, Benjamin Lefever, Lucas Ollagnier, Maxim Gadzhiev, Paul Blayac, Charly Cornu, étudiants ESTA Belfort, 05/2022

Mots clés : #decarbonization #energy #efficiency #economy #ecological transition

In 2019, the Government asked RTE, the electricity transmission network, to do a prospective work to reflect on the energy model of the France by 2050. RTE presented its first results on Monday 25 October. As a reminder, the France has set itself the goal of reaching zero net emissions in 2050 and less than 40% of energy consumption. Fossil fuels now account for 60% of energy consumption in France. Therefore, the challenge is ecological, but it is also of energy origin, regarding our dependence on fossil fuels imported from abroad.

Is it conceivable for us to get out of fossil fuels cleanly and quickly to start our eco-transition?

In the report, the achievement of these objectives goes through 3 main axes: The electrification of uses, the development of renewable energies and low-carbon energies, then the increase in energy efficiency and energy sobriety. The solution might be a mix of the different scenario that the RTE report deal with, and it is legitimate to consider several of them to achieve our objectives. There are two families of scenarios: there are three scenarios with 100% renewable energy and three other scenarios with the construction of new nuclear power plants. Even if RTE does not directly pronounce itself in favour of one scenario rather than another, it defends the energy mix and the renewable energy – nuclear duo for ecological but also economic reasons. RTE concludes by stressing that regardless of the scenario chosen, the urgency to act is the same. The President of the Republic should even make announcements in the coming weeks. It is essential to consult upstream with local elected officials who are at the heart of the ecological transition.

Figure 1: Production scenario 2050 
Source: Graph adapted by Le Monde from the RTE report “Energy Futures 2050”

 All these scenarios came up with the same conclusion including a security supply and a zero-emission balance in 2050. There are not all possible considering that electricity consumption is going to increase in the coming decades and that the nuclear plants are starting to get cost effective, and we will have to deal with nuclear energy in 2050. 

The “M” scenarios do not rely on the construction of new nuclear power plants with a total nuclear phase-out thereafter. The difference between these scenarios is the pace of development of renewable energies and the energies selected. The 100% renewable energy scenario is possible but difficult.  In all its scenarios, the means of flexibilities are essential because they are the ones that reduce the effect of the intermittency of renewable energy. They all start with an installed capacity of 1.7 GW of electric vehicles (V2G Vehicle to grid). Indeed, security of supply is fundamental. 

The “N” scenarios are based on the construction of new nuclear power plants. The difference between these scenarios is the pace of construction of new reactors. The scenario N03 provides for the construction of new reactors but also the extension of the current power plants. Scenario N also contains a lot of renewable energy. These scenarios are more varied and have the merit of being at the same time more realistic. They highlight nuclear, modular, and decarbonized technologies. 

Figure 2: Industrial and technological requirements associated with the different scenarios 
Source : Rapport RTE-AIE, Janvier 2021. 


The three main axes that will help to achieve our objectives:

Acting on consumption 

The reduction in consumption implies improving energy efficiency but also developing energy sobriety, less energy consumption by taking transport that emits little or no C02 instead of taking the car for short trips or even favouring appointments by videoconference instead of returning to the plane or the car to go directly to the appointment. The development of energy sobriety therefore implies a global change in our lifestyles.

Develop the means of management to maintain the balance between supply and demand: 

In all scenarios, it will be necessary to develop the means of control via the management of consumption thanks to digital, interconnections, hydraulic storage, and battery. To ensure this balance, it is also essential to rethink the transmission but also distribution network with significant and planned long-term investments. The need for flexibility is not the same depending on the scenario. Nuclear scenarios imply less flexibility. 

Considering the effects of climate change on the electricity system  

Temperatures in France are likely to rise to +2.9° between 2041-2070 compared to the period 1976-2005. Heat waves will multiply and be more and more intense but cold waves without wind will also be more numerous in winter. It is indeed climate change and not global warming that awaits us. To cope with this phenomenon, it will be necessary in the coming years to double the pace of investment in the network regardless of the scenario chosen. These investments will be used to adapt the electrical system but also to help the electrical system cope with the high heat that directly affects it. 

Development of renewable energies: solar and wind in particular 

The report insists on the need for a harmonious development of these energies. A 100% renewable energy scenario is possible but implies an acceleration of the development of renewable energies and their acceptability. This scenario, which involves the rapid closure of power plants, has a significant economic cost. Finally, the report highlights the competitiveness of renewable energies but also the need to develop large parks that allow economies of scale. RTE also calls for the need to maintain public support for both renewable energy and new nuclear reactors that will not arrive before 2035. It also defends the maintenance of a system of regulation of energy prices. On the issue of wind power and renewable energies, the report highlights a space issue especially for the 100% renewable energy scenario but rejects the idea of generalized pressure on the artificialization of soils. This pressure will be mostly localized. It also highlights aesthetic and heritage issues to be taken into consideration. These challenges will be found for small nuclear reactors with the addition of safety issues. On the issue of rare earths, RTE does not identify a risk of voltage but emits points of vigilance especially on metals such as lithium or nickel necessary for batteries. It is therefore essential at the same time to reduce the number of cars but also to reduce the size of the batteries and to promote their recycling as much as possible. For nuclear power, the report does not see a specific issue on uranium supply but draws attention to the issue of untreated or recycled nuclear waste. 

Developing low-carbon hydrogen, particularly in certain difficult sectors 

Hydrogen may be an attractive solution in replacing the original gas, but there are many uncertainties about the hydrogen economy. Hydrogen makes it possible to decarbonize sectors that are difficult or impossible to electrify economically and technically, such as industry or freight transport. The priority objective is therefore to replace fossil hydrogen with low-carbon hydrogen. For the scenario of the development and use of hydrogen we will in any case have a significant growth in electricity production. The production of hydrogen by electrolysis is flexible and adapts to renewable production. However, this flexibility is possible if hydrogen storage and transport infrastructure is acquired. For hydrogen to be flexible, it is important to develop hydrogen storage and transport infrastructures. 

Achieving carbon neutrality by 2050: 

To achieve this goal, it is necessary to understand that the electrification of uses must allow us to get out of our dependence on fossil fuels, particularly in transport and industry.  

Extending the life of nuclear power plants or replacing them with new generation reactors ready in 2050 only. 

According to RTE, the construction of new reactors is economically relevant. The extension of existing plants is a technical but also an economical challenge to avoid the “cliff effect” (Closure of plants at the same time since they were built in the same period and have the same lifespan). This extension appears mandatory because the new generation reactors will enter service at the earliest in 2035.

Figure 3: Cost of the main energy production chains produced for installations commissioned by 2050 
Source : Rapport RTE-AIE, Janvier 2021. 

Economic costs:

Whatever the scenario is, the cost of energy will remain stable or at least more stable than in the current system dependent on gas and oil. Only the photovoltaic on small roofs remain more expensive than the new nuclear. RTE estimates the current full cost of the electricity system at €45 billion per year. In 2050, in its report, it oscillates between 59 (scenario N03 with 50% nuclear in 2050) and 80 billion euros (scenario M1, with 100% renewable energy in 2060) annually in total. 

On this graph, we note that nuclear costs more than renewables energy.  However, the disadvantage of renewable energy is that they participate into the destruction of the landscape (Wind and photovoltaic on the ground). The advantage of new nuclear being that it allows to centralize in one place the electricity produced.

Figure 4: Annualized full costs of scenarios to 2060 
Source: Figure 11.32, chapter 11, Energy Futures 2050  

We notice that the higher the share of nuclear power in the chosen scenario, the lower the cost of flexibility is, which costs a lot of money. A scenario that intelligently combines nuclear power and renewable energy seems to me the most desirable.  

Which scenario seems to be the most realistic? 

The N1 and N2 scenarios seems to me the most interesting because they have a more reasonable cost.  N2 scenario would make it possible to keep a reasonable share of nuclear power and to develop renewable energies over the years. Overall, we can achieve the electricity system of carbon neutrality by 2050 at a controllable cost for our country. We need to develop mature renewable energies as quickly as possible before about ten years and we need to extend existing nuclear reactors to maximize our low-carbon production. Finally, the clearest conclusion we can make is that there is urgency, no matter which scenario is chosen. 

According to the Figure 1, we can see that the N2 scenario is positioned with 63% renewable energy and 37% old and new nuclear. It will mainly develop solar at 20%, onshore wind at 20% and new nuclear installations at 22%. 

According to the Figure 2, the N2 scenario slightly accelerates the deployment rates of terrestrial renewable energies, develops, and connects new marine energies, compensates for the variability of renewable energies by means of adapted flexibilities. It will also weakly reconfigure networks and evolve operational reserves. This scenario will moderately ensure the stability of the electrical system and extend some current reactors up to 60 years. N2 scenarios will greatly accelerate the commissioning of a large number of new reactors between 2035 and 2050 (one pair of reactors every 3 years).  According to the Figure 4, from the graph we can see that the N2 scenario by 2060 will mainly invest in nuclear and renewable energies. We also see that the N2 scenario has a more reasonable cost than the other scenarios.

Références

https://www.rte-france.com/analyses-tendances-et-prospectives/bilan-previsionnel-2050-futurs-energetiques

https://assets.rte-france.com/prod/public/2021-12/Futurs-Energetiques-2050-principaux-resultats.pdf

https://www.youtube.com/watch?v=XbrcUz0pu80&t=1s

Technological bet : Will Science repair our planet ?

Par Léonore Gandy, Lucile Chassel, Ilyes Barre, Loïc Gisselaire, Olivier Blessing, Quentin Fornas, Nael Fesquet, étudiants ESTA Belfort, 05/2022

Mots clés : #greentechnology #globalwarming #decarbonation #biomass #co2captation #ademe #scenario

Our way of life is the result of technological advancements spurred by the first industrial revolution, which enabled us to overcome millennial challenges and show up where we are today. Science has allowed us to perform miracles that were previously reserved for spiritual entities: Agricultural yields are excellent, oil has replaced elbow grease, and medicine allows us to increase our life expectancy. However, after decades of uninterrupted growth, and despite warnings, we are witnessing unprecedented changes that we will have to deal with sooner or later. Overconsumption, pollution in all forms, decreased agricultural yields due to soil depletion, and mass extinction are all factors. In a century, humans left an indelible mark on our planet. So, what should we do in a world where technological innovation solves all of our problems? We choose the same approach because we are afraid of losing what we have: a life of abundance, comfort, and security. In this case, let us imagine a future in which technology solves our problems, based on two ADEME scenarios: green technologies and the reparative bet. This organization has, in fact, listed four possible scenarios for reducing human impact on climate change:

  • Frugal generation (scenario 1) : Respect for nature, use of robust and easily repairable technologies (no programmed obsolescence), limitation of constructions and renovation of old ones, modification of eating habits and reasoned mobilization of forest resources, reduction of mobility and favoring of soft transport, reduction of industrialization and favoring of short circuits.
  • Territorial cooperation (scenario 2) : Acceleration of the food transition, development of advanced biofuels, energy renovation of buildings, densification of housing (building sharing), local mobility, industrial transport focused on rail and waterways, recycling and re-industrialization in targeted sectors.
  • Green Technologies (scenario 3) : Maximum use of biomass for multiple purposes, electrification of vehicles, renovation and decarbonization of housing, decarbonization of industry through the use of hydrogen and electrification of processes, capture of CO2 emitted by biomass.
  • Restorative betting (scenario 4) : Highly competitive food industry, improvement of equipment efficiency and creation of efficient technologies, exploitation of natural resources and recycling pushed to its maximum thanks to advanced technologies.
Figure 1: ADEME’s 4 scenarios
Source: Adapted from ADEME data (2022), accessed in April 2022

Each scenario changes our habits in order to achieve carbon neutrality and build a better future. While scenarios 3 and 4 are more about changing consumer behavior and new technologies, scenario 4 is a risky bet on CO2 capture and storage technologies, BECCS and DACCS, which are still in the early stages of development. But all four scenarios have one thing in common: we need to act quickly so that the changes, which will take a long time to be accepted and implemented by the greatest number of people, can be applied and have an impact before it is too late.

What would the future look like if we develop green technologies (scenario 3) ?

Following the third scenario of the Ademe report, it is about developing technologies that enable us to respond to environmental challenges rather than changing our behavior to be sober. It’s not so much about changing « what » we do as it is about changing « how » we do it. Companies, for instance, produce slightly less than they do today in terms of output, but they are still significantly more decarbonised. The means of transport are a bit smaller but the vehicles are lighter and electric: this is how we look at how to get closer to carbon neutrality in this scenario. Nature is seen as a set of resources to be developed, used and optimized for the benefit of humans, in a relationship of mutual growth between natural ecosystems and intense human activity in all fields of the economy. Technologies are at the service of the environment, as a means of knowledge, but also of opportunities because they bring flexibility and also new capacities of adaptation.

Energy:

Turning to a decarbonized and sustainable production, our dependence on fossil fuels will decrease. Our objective is to capture CO2 and store it in the soil while developing biomass, mainly forestry, to produce energy. We are developing the production of renewable fuels from biomass, to produce 98 TWh, despite the 76% drop in demand for liquid fuels due to electrification. This is still very costly because the demand for decarbonized energy is driving up its price. We can also note that with a strong intensification of digital technology, data centers will consume 10 times more than in 2020. Concerning mobility, the State regulates infrastructures and encourages massive telecommuting and carpooling. Thus, even if an increase of 13% of additional kilometers per person are to be expected, 30% are trips on foot or by bike.

Agriculture:

Concerning food and agriculture, the choices are to reduce our meat consumption by 30%, and at the same time develop the consumption of organic and local products in order to reach 30%. We increase the surface of energy crops and we intensify agriculture with an important use of synthetic inputs to compensate. In order to preserve the biodiversity, we set up a natural capital

In a few statistics: 

  • 30% reduction in meat consumption
  • 86% reduction of greenhouse gas emission in the industry
  • 60% of the materials used are from recycling

Can we repair our mistakes and preserve our lifestyle ? (scenario 4)

This last scenario is the one in which our way of life is most preserved by relying on our ability to repair our damage. It is also the one that our societies naturally gravitate toward because it refers to an ideal of growth and complete control of Man over his environment. Aid to struggling countries is accelerating globalization.

This fourth scenario is based on two dynamics:

  • A global middle class that contributes to robust growth in production and consumption
  • A digital revolution that makes life easier for citizens and businesses. (Digital technology is very energy-intensive)

Strategic stocks are established in this scenario to deal with climatic hazards that will become more frequent and, undoubtedly, more powerful. Man is able to technically master nature and propose a targeted solution to each ecological challenge.

In the face of climatic hazards, an insurance market is established to protect each individual from the consequences. Everyone will be required to subscribe to and contribute to mandatory insurance policies that will cover these climatic risks.

Agriculture and the food industry have become increasingly specialized. Meat consumption has decreased by 10% and is now supplemented by alternative proteins (insects or synthetic). Agriculture is evolving into a sector that employs all available technologies to maximize output while minimizing environmental impact. This transition, however, will result in a 65 percent increase in irrigation water.

In terms of housing, new constructions are maintained and only half of the existing ones will be renovated to a very high level of insulation (low-energy buildings). The performance of equipment is improved to combine technological innovation and energy efficiency.

Because of an increase in long-distance travel, the number of kilometers traveled by individuals increased by 39%. (mainly air travel). The individual car retains its central position, but despite limited access to available resources, the use of technological progress (electrification, biogas, biofuels, renewable energies) is increasing.

In a world where consumption outpaces production, markets rely heavily on imports to satisfy the population by providing an increasing number of options. Domestic production focusing on decarbonization, CO2 capture, and geological storage supplements these imports. Natural resources and significant recycling, at the cutting edge of technology, are used to meet resource needs by proposing ever-increasing production. As a result of these new technologies, industry, which is one of the most polluting sectors, will reduce its energy consumption by 19%.

In Scenario 4, we must rely on certain foreign countries’ specialization in the production of decarbonized or renewable gas. This action will result in a 51% increase in overall gas decarbonization.

Carbon capture and storage (CCS) and technological sinks are critical in this scenario because they will lead to industry decarbonization. This strategy has the effect of drastically altering the forestry landscape by removing hardwoods and replacing them with faster-growing softwoods.

In a few statistics:

  • 10% reduction in meat consumption
  • 19% reduction in energy consumption in industry
  • 45% of the materials used are from recycling

What are the different environmental and lifestyle outcomes between scenarios 3 and 4?

Let’s start with the societal point of view, there is no real difference between the 2 scenarios: the similarities and differences between the two ADEME scenarios are shown in Figure 2. One tends only towards a little sobriety while the other saves a mass consumption. Although the services provided by nature are optimized, it is above all a resource to be exploited.

For food, scenario 3 is more moderate: it foresees a decrease in meat consumption of 30% and also a share of organic food of 30%. Scenario 4 envisages a decrease of only 10%, supplemented by synthetic or vegetable proteins.

Concerning housing, a maintenance of new constructions is foreseen in the « repairing bet », for scenario 3, a deconstruction-reconstruction on a large scale is envisaged. As for renovation, while in scenario 4, half of the housing is renovated to a high level, scenario 3 goes further by renovating all the housing but not in a very efficient way.

Finally, for the mobility of the populations, the 3rd scenario opts for a regulation by the State as regards infrastructures, massive telecommuting or carpooling. 13% more km are covered per person on average but 30% of these trips are made on foot or by bicycle. The last scenario is looking for speed, it foresees an increase of 28% of km per person for 20% of the trips made on foot or by bike.

Concerning the environment, the comparison is made with the year 2015, during which we consumed 1772 TWh. Each sector (Industry, Transport, Residential, Tertiary and Agriculture) are each between 200 TWh for the tertiary and 500 TWh for agriculture. In 2050, scenario 3 « consumes » 1062 TWh, with a slightly lower share for agriculture than for the other sectors. The scenario is rather balanced with almost 4 equal shares for a total of 1287 TWh.

Renewable energies represent a very large share in all scenarios: 70% for scenario 4, between 81 and 87% for scenario 3. Although these rates are lower than in the other two scenarios, this represents a much larger amount of energy (900 TWh).

Figure 2: Comparison between scenario 3 and scenario 4
Source: Adapted from ADEME data (2022), accessed in April 2022

What risks is society willing to take to maintain its current way of life?

In a society where technology guarantees quick access to desired products and services at a lower cost, how and which classes of individuals would be willing to sacrifice some of their pleasures and needs?

Today’s population is increasingly encouraged to use what is necessary and not to overconsume, but this does not necessarily mean that they can live without some of the everyday things that are considered vital by their users.

Let’s give an example from scenario 3 and 4: reducing meat consumption during meals by 10 to 30% is for some a superhuman effort and for others a mere formality. It may also depend on the income of people belonging to these social classes. Indeed, some can afford to buy biologic products and consume synthetic or vegetable proteins (more expensive) to supplement their daily protein intake but some cannot.

The implication and the guilt for the survival of future generations is specific to each person, that is why we think that the best solution would be to impose a policy based on the last two scenarios, in small doses and thanks to social aid.

Should the future be a mix of all these scenarios?

Each scenario has its own voice and strategy. But can we imagine that from these scenarios we can create new ones?

We can imagine that combining these four scenarios will allow us to achieve carbon neutrality by 2050. We could combine ideas from all of them to create a new one that is more suited to French society. We believe that in order to achieve carbon neutrality, we will need a committed government and a motivated population. As a result, we could envision a scenario in which a strong policy would be directed and supported without being perceived as restrictive by the French. One solution that pops up is to put several proposals to a vote in a referendum. This would allow the government to determine whether or not the French are willing to make a sacrifice. The government would then commit to going in the direction chosen by the French. Obviously, this will have to be supplemented by public education about the climate emergency. His ideas will enable us to reach a commitment that is shared by all, making us far more effective.

Can we really imagine such scenarios in today’s globalized world?

Of course, we must keep in mind that the objectives outlined in the various ADEME scenarios are extremely difficult, if not impossible, to achieve if each and every country does not play its part. The geopolitical stakes pose a significant challenge; specifically, how can the commercial exchanges that result from globalization be reduced? We can anticipate that future technologies will enable trade to produce fewer greenhouse gas emissions. Scenario 3 envisions trade concentration in Europe in order to limit long transports and, as a result, create a continental economic model. In terms of the rest of the world, the poorest countries do not pollute the most because of their citizens’ living standards. Habits must be drastically altered, particularly in developed countries, but this will be difficult. Is the world willing to give up the convenience of globalization for the sake of environmental health?

Conclusion

Scenarios 3 & 4 are very ambitious and above all extremely risky. The anticipated changes are in all cases very long to put in place, whether it is a question of changing the behavior of companies in their production methods or the attitude and habits of consumers.

This bet is nevertheless necessary when the objective is to reach carbon neutrality.

Références

An energy economy for the future and the different paths toward it

Par Elisa Harnist, Irem Celebi, Jérémy Koegler, Stéphane Polin, Thibaud Troncin, Mathieu Deschamps, Arthur Grosse, étudiants ESTA Belfort, 05/2022

Mots clés : #Emissions #scenarios #IEA #energytransition #energyeconomy #electricvehicle

Global warming is now having an undeniable impact on the planet and the ecosystem. Limiting the global temperature rise to 1.5 °C without a temperature overshoot is becoming a key issue of our time. 

The four scenario of iea for a better energetic transition

As a result, the World Energy Outlook published in 2021, a report on energy transition, highlighting possible long-term scenarios.  In this report, we have an overview of how far we have come in the transition to clean energy, but also how far we still must go. As we can see, energy plays a crucial role in human well-being and the social and economic development of countries. Almost three quarters of global greenhouse gas emissions come from the energy sector. Several actions are being taken by determined governments to limit these emissions. The scenarios are based on rigorous modelling and analysis.

In this report, the Energy Outlook 2021 detailed projection for four scenarios were modelled:

  • The Net Zero Emissions by 2050 (NZE) scenario
  • Announced Pledges Scenario (APS)
  • Stated policies Scenario (STEPS)
  • The Sustainable Development scenario (SDS)
Figure 1: The Scenarios of IEA

Net Zero Emissions by 2050

This scenario is a normative IEA scenario that shows a narrow but achievable pathway for the global energy sector to achieve net zero CO2 emissions by 2050.  It is also a scenario that corresponds to United Nation sustainable Development Goals, particularly by achieving universal energy access by 2030 and improving air quality. The aim of the NZE is not to reduce the emissions from outside the energy sector to achieve its goals, but assumes that non-energy emissions will be reduced in the same proportion as energy emissions. This scenario is compatible with limiting the global temperature rise to 1.5 ° C.

The objectives are to show what is needed across the main sectors by various actors and by when, so that the world can achieve net zero energy related and industrial process CO2 emissions by 2050 while meeting other energy-related sustainable development goals.

Announced Pledges Scenario (APS)

This scenario aims to show to what extent the announced ambitions and targets are on the path to reduce the emissions required to achieve net zero emissions by 2050. It includes all main recent national announcements of 2030 targets and longer-term initiatives to net zero emissions.

A scenario which assumes that all climate commitments made by governments around the world, including Nationally Determined Contributions and longer-term net zero targets, will be met in full and on time. The main aim is to show how close current pledges bring the world to the goal of limiting global warming to 1.5° C. It highlights the « ambition gap » that needs to be closed to achieve the objectives agreed in Paris in 2015.

Stated Policies Scenarios ( STEPS)

The steps take a more conservative and sceptical view of whether governments will achieve their targets. The scenario takes into account sector by sector what has actually been put in place to achieve the targets, taking into account existing and developing measures. The STEPS explores where the energy system might go without a major additional steer from policy makers. As with the APS, it is not designed to achieve a particular outcome.

The objective is to provide a benchmark to assess the potential achievements (and limitations) of recent developments in energy and climate policy.

Sustainable Development Scenario  (SDS)

The SDS represents a gateway to the outcomes targeted by the Paris Agreement. As the NZE, the SDS is based on a surge in clean energy policies and investment.

In the scenario of the SDS, all current net zero pledges are achieved in full and there are extensive efforts to realize near-term emissions reductions. by 2050, the advanced economies reach net zero emissions, China around 2060, and all other countries by 2070 at the latest. This scenario is consistent with limiting the global temperature rise 1.65 °C, without assuming any net negative emissions. The objective is to demonstrate a plausible path to concurrently achieve universal energy access, set a path towards meeting the objectives of the Paris Agreement on climate change and significantly reduce air pollution.

Designing a new energy economy

There are clear signs of change, given recent developments in renewable energy (including wind and solar PV) and electric vehicle sales. However, while a new energy economy is emerging, it is not happening fast enough to avoid the serious consequences of climate change.

Electricity plays an increasingly central role here. Indeed, the share of electricity in final energy consumption has globally increased over the last decades. In NZE, electricity accounts for around 50% of final energy consumption by 2050 (around 30% in APS).

Clean technologies are becoming a major area of investment and international competition in the new energy economy. In NZE, annual market opportunities for manufacturers (wind turbines, solar panels, batteries, electrolysers, fuel cells) are multiplied by 10 by 2050 and then become more important than industry current oil and associated revenues.

Clean energy innovation also appears key to decarbonizing heavy industry and long-distance transportation.

Scenarios, trajectories and temperature

Attached is a detailed assessment of the path taken by the countries in their energy transitions, but also an edifying observation of the path that remains to be travelled. according to the Figure 2, in NZE, global energy-related CO2 emissions drop to 21 GtCO2 in 2030, marking a decisive change in direction (34 GtCO2 in APS, 36 GtCO2 in STEPS) 3.

Figure 2: CO2 Emission – Scenarios – 2000/2050
Source : World energy outlook 2021 report, consulted in April 2022

In particular, the APS highlights the risk of creating a world in which the achievement of “net zero emissions” commitments in some countries is coupled with limited efforts to reduce emissions in others. The implementation of the NZE scenario is highly dependent on the collaboration of all governments, to be effective.

Keep targeting the 1.5°c goal

An additional 12 GtCO2 emissions will need to be reduced in 2030 to put the world on the path to NZE. As such, there are four main priorities for action to close this gap over the next decade and set the stage for faster emissions reduction beyond 2030:

  • Ensure the intensification of clean electrification;
  • Realize the full potential of energy efficiency;
  • Prevent methane leaks from activities related to fossil agents;
  • Driving clean energy innovation.

While clean electrification, efficiency and reducing methane emissions are the main efforts of the next decade, these actions cannot lead to the goal of net zero emissions. As such, boosting clean energy innovation is essential to ensure that new technologies are ready for deployment in the 2030s.

Clean electrification: Coal remains the largest source of electricity in the world (>1/3 of electricity supply) and by far the largest source of emissions from the electricity sector (3/4 of CO2 emissions from the electricity sector). As such, a rapid decarbonisation of the electricity mix (including the use of nuclear energy where acceptable) is the most important way to close the gap between APS and NZE by 2030.

The rapid decarbonization of the electricity sector also requires a significant deployment of low-emission generation. The greatest potential for deployment to close this emissions gap mainly concerns solar photovoltaic and wind power.

Energy efficiency: Improving energy efficiency will reduce the demand for electricity and fuels of all kinds. Strengthening energy efficiency policies is particularly important in the transport and building sectors. Behavioural changes also contribute to emission reductions, particularly in the transport sector. Stricter standards for aircraft and fuel use are also essential to improve efficiency.

Methane: Methane has contributed about 30% of the current global temperature increase. The 6th IPCC Report7 stresses that a rapid and sustained reduction in methane emissions is essential to limit short-term warming.

In the NZE, total methane emissions from all farms using fossil fuels have decreased by around 75% by 2030, in particular linked to a rapid deployment of emission reduction measures and technologies, which leads to the elimination of all technically avoidable methane emissions by 2030.

Innovation: Almost half of the emission reductions achieved in the NZE in 2050 come from technologies that are still currently in the demonstration or prototype stage. As such, governments should increase their support in key technology areas (advanced batteries, low carbon fuels, hydrogen electrolysers, negative emissions technologies, etc.).

Mobilize investment and financing

To get on track for net-zero emissions by 2050, investments related to the energy transition need to accelerate to nearly USD 4 trillion per year by 2030. According to the APS, this expansion is characterized by an increase in annual investments of USD 1.1 billion in clean energy production and electricity infrastructure and USD 0.5 billion in energy efficiency and decarbonization (building, industry and transport), as well as a rapid intensification of low-carbon fuels (hydrogen and bioenergy). Mobilizing clean energy investments will depend on securing local and international financing.

If the clean energy transition is to be successful, developers and private financiers must increase the amount of capital they allocate to the energy transition and to emerging and developing economies. A multidimensional effort will also be needed to manage the financial and human consequences of phasing out emissions-intensive assets like coal-fired power plants.

People: heart of transition

If the transformation of the energy sector consists in reducing GHG emissions, it also aims to improve the quality of life: eradicating energy poverty and considering the issues of employment, equity, inclusion, accessibility, and sustainable economic development.

Large-scale transitions require broad social acceptance and engagement across society. In the NZE, at least half of the emission reductions by 2030 involve consumer buy-in (e.g., choice of heat pump) or behavioural changes (e.g., mode of travel).

​​Obtaining public support for change involves difficult trade-offs. For example, creating subsidies for heat pumps could make natural gas more expensive, introducing a carbon tax could provoke a negative reaction from low-income households in the absence of effective means of managing the distributional consequences.

Gradually toward zero coal

All scenarios that meet climate goals show a rapid decline in coal use. Indeed, it is not only the fuel with the highest carbon intensity, but also the one whose main use is in a sector (i.e., electricity production) where renewable energy options are the most profitable on the market. market.

Phasing out coal in the electricity sector has two aspects: halting the construction of new plants and reducing emissions from existing facilities.

Reducing emissions from the existing fleet of power plants is particularly difficult to carry out: given the dependence on coal in a number of regions, the closure or conversion of coal mines and power plants could have significant economic and social consequences.

Phasing out coal at the scale and pace required in the NZE requires a comprehensive and sustained commitment from national and local governments and the international community to manage the transitions.

Cost, price and affordability

The 2021 economic recovery has led to an increase in prices, especially for the critical materials such as copper. The study said that if the prices stay like this, investment costs in 2030 can increase to between 400 and 700 billion. The problem is that if the price difference between fuel or fossil energy and the power sector is too high, more investments will be made for the fuel sector.

To deal with this problem, the new technology and the optimization of existing products will help to have energy at an affordable price. This process will need a large investment to find solutions. To add to this, each scenario explains an increase of the energy price for the householders. It is why nations must play a game to help households.

The risks of the energy transition

For example, there may be investment shortfalls, underdeveloped technologies or poor policy that may hinder the energy transition. The goal is to move from carbon-intensive to near-carbon-intensive energies.

Between the different assumptions, the oil demand rate varies greatly. However, by 2050, it is estimated that oil demand will fall by 50 percent. Politics will play a very important role in this decline.

Another problem we are likely to encounter is the storage of electricity. Currently, electrical energy accounts for 10 percent. However, according to all scenarios, this share of renewable energy will have to reach 40 to 70 percent by 2050. We will therefore need new ways of electricity stocking.

There will also be a strong variation in supply and demand. We will therefore have to know how to adapt to this. By 2050, 40 percent of primary energy will be converted twice before being distributed to users. This will require a change in the way energy systems work.

Furthermore, thermal vehicles and gas boilers can only be stopped if a reliable way of replacing them is found. We need to find low-carbon solutions at the same or lower prices than today.

We must also face the risks of climate change. Part of the electrical network, refineries and thermal power stations are exposed to natural hazards. These energy systems need to be strengthened and increased.

Clean energy technologies depend on geopolitical contingencies. There may be changes in law, trade restrictions or political instability. To be a dependent minimum, we need to increase recycling and resilient supply chains.

Fuel : old and new

Having ecological electricity is a target for each scenario, electrification everywhere is not possible. In 2050, the study shows that the energy consumption of electricity will be less than 50 % of the energy bill. Fossil energy will be a major part of the energy mix until 2050.

The demand for oil is declining for each scenario. However, natural gas is increasing to try to produce low carbon energy. For the NZE scenario, 50% will be used to produce low-carbon hydrogen in 2030 and increase to 70% in 2050. The coal will stay here but with a big drop with each scenario.

With the different scenarios, the low-emission alternative fuel will be more and more present to replace the old fuel and oil. The new fuel will play a major part to have 0 net emission. Progress by 2030 will be critical to the future success of low-carbon hydrogen and hydrogen fuels.  In particular, success will depend on significant investments to reduce production and transport costs to ensure that new equipment and vehicles are quickly available on the market.

Electric mobility

Today, the energy transition depends to a large extent on the electrification of our means of transport! However, not all means of transport are destined to be electrified for various reasons. Europe and Asia lead the global EV (electric vehicles) markets. The electrification of road transport accelerates, but at varying speeds across the world.

2030 will be a pivotal decade for road transport electrification, with an estimated number of electric vehicles (EVs) of 145 billion in 2030, with only 11 million nowadays.

As we mentioned before, not all the road transport segments could be electrified, it’s especially the case for medium- and heavy-duty trucks, where only 3% of the total truck stock would be electrified by 2030 in the best-case scenario (SDS). In contrast, the two/three-wheelers are the most electrified road transport segment today, they represent more than 20% of the total EVs fleet. Their light weight, the short driving distances are very optimal because they require small batteries and are very easy to set up. Their growth is very fast, especially in Asia. They will represent more than half of all sales by 2030.

The light-duty vehicles (LDVs) are also conducive to the electrification segment. Their number will increase by 8% per year against 1% today, to reach 140 million vehicles in 2030. The sales share will rise to 35% according to the SDS against 15% in the STEPS, this represents an 80% increase relative to the STEPS.

For the buses, the electrification is mostly limited to urban buses. The bus segment is expected to electrify faster than light-duty vehicles! With a 1.6 million fleet (STEPS) in 2030  (600 000 nowadays). In the SDS scenario, there will be 5.5 million electric buses in 2030 being more than 15% of the stock.

Europe is expected to lead the global electrification of LDVs in both scenarios. By 2030, the electric LDV sales share will be about 40% in STEPS and 80% in SDS. Their EV sales share will be similar to China in STEPS but require higher electrification efforts by 2030 to meet the EU net zero 2050 target in SDS. With around 60% of two/three wheelers sold in electric, China will lead the electrification of this transport section.

Références

IPCC AR6 WGII – Transition to a Climate Resilient Development

Par Elisa Joubert, Alexandre Semard, Solène Moench, Thien-Kim Nguyen, Romane Decellières, Matthieu François, Laura Gauthier, Charlotte Ravaux, étudiants ESTA Belfort, 05/2022

Mots clés : #climate change #impacts #climate risks #adaptation #climate resilient #development

The interdependence of climate, human societies, ecosystems and biodiversity is a concept that need to be understood to evaluate impacts and risks of non-climatic global trends such as biodiversity loss, human demographic shifts, land and ecosystems degradation… This assessment integrates knowledge across the natural, ecological, social and economic sciences.

In the current climate, it is more important than ever to assess the risks and impacts of climate change until the end of the century and what are the actions we must take to transition to a climate-resilient development.

This article is a synthesis of the Summary for Policymakers of the IPCC AR6 WGII.

Interactions between the different systems

Figure 1 is a representation of the different interactions between the three coupled systems that are climate, ecosystems and human society. Biodiversity is also included in the ecosystems. Part (a) is the actual situation and depicts the impacts and risks of climate change on human society and ecosystems. Both can adapt and mitigate these impacts, but the impacts will inevitably lead to losses and damages. Human society causes climate to change because of its greenhouse gas emissions. Human society and ecosystems interact together through conservation and restoration from the human society while ecosystems provide livelihoods and ecosystems services to human society.

Part (b) of Figure 1 represents the actions required to transition from the actual situation to climate-resilient development. These actions can be enabled by governance, finance, knowledge and capacity, technologies and catalyzing conditions. The decisions must be taken with the aim of achieving human health and well-being (in equity and justice), ecosystem and planetary health.

The concept of risk is the result of the vulnerability and exposure of human and ecological systems to climate-related hazards. To reduce vulnerability and exposure, systems must demonstrate adaptation through ecological and evolutionary processes. Only the human systems can anticipate their adaptation.

Figure 1: Interactions between climate, ecosystems and their biodiversity and human society
Source: IPCC AR6 WGII, Summary for policymakers

Observed and future risks and impacts

Through the years, knowledge of impacts and risks related to climate hazards, vulnerability and exposure has developed. In this part, the expression of impacts and risks in terms of damage, economic harm and non-economic losses will be discussed. The projection of risks is done for a short-, mid-, and long-term effect (respectively 2021-2040, 2041-2060 and 2081-2100).

In the current situation, the climate change has caused impacts, losses and damages to nature and people because of extreme events which tend to be more frequent and intense. Even though the vulnerability of systems has been reduced thanks to development and adaptation, the most vulnerable systems are disproportionately impacted. Some systems already suffered from irreversible impacts and human systems sometimes exhausted their ability to adapt. The vulnerability of ecosystems and people is different among and within areas. Factors taken into account are socio-economic development, unsustainable ocean and land use, marginalization, historical and current inequities (e.g. colonialism) and governance. Between 40 and 45% of the global population lives in highly vulnerable contexts to climate change and the on-going unsustainable development patterns increase the exposure of systems to climate hazards.

Each observed impacts on systems are measured with a confidence factor concerning the attribution to climate change. In addition to this factor, it specified whether the impacts are only negative or also positive at the same time for human systems.

Part (a) of Figure 2 concerns the observed impacts of climate change on ecosystems. Globally, in most of the terrestrial, freshwater and oceanic ecosystems, climate change has affected ecosystems structure, species geographic ranges and phenology (life cycles) with high confidence.

Part (b) of Figure 2 is about the impacts of climate change on human systems and focus on water scarcity/food production, health and well-being and cities, settlements and infrastructures. At a global scale, climate change mostly has adverse impacts on these elements.

Figure 2: Impacts of climate change on human and ecological and human systems
Source: IPCC AR6 WGII, Summary for policymakers

Risks in the near future (2021-2040) are estimated by considering the temperature increase of 1.5 °C. This temperature rise would inevitably cause an increase in climate hazards and multiply the risks for ecosystems and humans. The actions that would cap global warming to these 1.5 °C would restrain losses and damages in comparison to other scenarios with more important levels of warming. Unfortunately, eliminating this increase remains impossible.

On a mid to long-term scale (2041-2100), the assessment of climate-related risks depends on the level of global warming that be reached at this time. For over 100 known risks, the estimated level of impact will reach up to multiple times the current rates. Near term adaptation and mitigation decisions are the key to keep the magnitude of risks arising from climate change at lower rates.

Here is a list of some risks for different systems:

  • Ecosystems: in every environment (terrestrial, freshwater and oceans), the species will be subject to higher risk of extinction, between 3% and 48% depending on the location and the level of temperature increase. This loss of range will directly affect the ecosystems structures and the phenology.
  • Water scarcity: with a 2 °C temperature raise, snowmelt water allocated for irrigation should decrease by 20% and around 18 ± 13% of the global glacier mass will be lost. This will impact agriculture, hydropower and human settlements.
  • Human health and well-being: vulnerable populations (youth, elderly and people with health problems) will face mental health troubles such as anxiety and stress due to the increasing global warming.
  • Cities, settlements and infrastructures: the percentage of people potentially affected by a 100-year coastal flood will increase by 20% if the sea level rises by 0.15 m and by 60% in the case of a 1.4 m raise.

Adaptation measures

All sectors and regions has made progress concerning planning and implementing adaption, thus creating benefits towards the reduction of climate-related risks. However, the distribution of the progress has not been made evenly. A lot of these progress are focused on near-term effect, leading to a decrease in the opportunity for transformational adaptation.

Across the years, countries and cities decided to implement adaptation in climate policies, due to the rising public and political awareness around climate change. There is an increase in the use of other means like decision support tools or climate services, projects and experiments are conducted in different sectors. All these actions not only help to reduce the risks and damages, but also they provide benefits for human society in many fields (health and well-being, food, biodiversity conservation…).

Despite the efforts made to set up these actions, a gap still exists with the level of adaptation required to fully counter the impacts and reduce the risks. The actions are mainly fragmented and focused on planning instead of actual implementation. Most of the time, the estimated costs of the measures does not match the allocated budget to conduct the project. In lower income population groups, the adaptation gaps are at the highest rate.

Figure 3 gathers the different feasible responses that humanity could set up to reduce the main risks of climate change and the impact they would have on system transitions (Land/ocean ecosystems, urban and infrastructures systems, energy systems and cross-sectoral). These information are given for a global scale at near term and within the 1.5 °C temperature increase. Above this temperature increase, the feasibility of the measures may be different. The scaling for the feasibility of climate responses take into account six dimensions (economic, technological, institutional, social, environmental, and geophysical) and their synergies with mitigation.

Figure 4 represents the benefits of climate responses and adaptation options for ecosystems, social groups and the 17 Sustainable Development Goals (SDG).

Figure 3: Measures to respond to different risks of climate change and their feasibility
Source: IPCC AR6 WGII, Summary for policymakers
Figure 4: Benefits of the climate responses for different systems and the 17 SDG
Source: IPCC AR6 WGII, Summary for policymakers

The adaption options depicted in the above figures (3 and 4), will result in a decrease of risk to people and ecosystems. However the feasibility of these options differs depending on the sector or the region they are implemented in. Moreover, the effectiveness decreases as the global warming increases.

Here are some measures that are feasible and the system that would benefit from it:

  • Land, oceans and ecosystems: early warning systems and structural measures for inland flooding in order to reduce human losses.
  • Urban, rural and infrastructure transition: partnerships including governments, civil society and private sector organizations to upgrade the ability of adaptation of vulnerable populations.
  • Energy system transition: development of different energy sources, integrating renewable energy (solar, wind…) reduces the vulnerability of populations.
  • Cross cutting options: improving surveillance, warning systems and vaccine development help are effective adaptation options to manage vector borne diseases.

However, despite the set up actions, soft and hard limits to systems adaptation exist. The soft limits that strikes human systems include the lack of literacy and information or the inequity and poverty that restrain adaptation. The soft limits can be overcome by working on the fields of finance, governance, institutions and policies. On the other hand, natural systems are subject to hard limits, such as coral reefs, coastal wetlands or rainforests.

These adaptation options require enabling conditions to be implemented, accelerated and sustained in human and ecological systems. Enabling conditions means political commitment, institutional frameworks, policies, knowledge on impacts and solutions, financial resources as well as monitoring, evaluation and governance processes.

Political commitment will require large investments (in terms of human, financial and technological resources) at the beginning and the results could take a decade or more to be tangible.

Institutional frameworks and policies will provide clear objectives for adaptation and set the responsibilities amongst the actors and governments. Adaptation options will be enhanced by the integration of measures in financial and policies planning cycles.

Acquiring knowledge about risks, impacts and their consequences promotes societal and policy solutions. Using this concept at every scale like education, information programs, arts, Indigenous knowledge… will deepen climate knowledge, facilitating awareness, risk perception and influence behavior.

The access to financial resources are necessary to implement adaptation options and reduce the existing gaps for vulnerable groups, regions and sectors. Finance and public mechanisms can be a lever to private sector finance for adaptation by addressing real and perceived regulatory, cost and market barriers, through public-private partnerships for example.

Monitoring and evaluation of adaptation options are the key to track progress and to provide an effective adaptation. At the moment this process is limited and focused on planning and implementation. The next step is to increase the monitoring on outcomes to track effectiveness.

Inclusive governance prioritizing equity and justice concerning the adaptation obtains more effective and sustainable outcomes. Carefully designing and implementing laws, policies, processes and interventions reduces vulnerabilities and climate risks. This approach focus on capacity-building of the most vulnerable and marginalized groups so that they can access to key resources to adapt.

Climate resilient development

A climate resilient development (CRD) includes the adaptation measures and their enabling conditions depicted sooner, with mitigation to provide sustainable development for all. The concept integrates system transitions (in land, ocean, cities, energy, industry and society) and includes adaptations for human, ecosystems and planetary health.

The evidence of observed impacts, future risks, vulnerabilities and adaptation limits proves that the transition to a worldwide resilient development action is becoming urgent. Responses can use the synergies and reduce the gap between adaptation and mitigation for a sustainable development.

Figure 5 represents the pathways that will lead to different outcomes depending on our actions. Part (a) is the two different axes that can be chosen, either going towards higher CRD or a lower one. Part (b) is about the cumulation of societal choices that will define the level of CRD. The past conditions cannot be changed and already eliminated pathways towards a higher level. The progress to a high CRD becomes more and more difficult as the global warming increases. The final part (c) shows the actions and outcomes of the different pathways.

Figure 5: Window of opportunity to transition to climate resilient development
Source: IPCC AR6 WGII, Summary for policymakers

“It is unequivocal that climate change has already disrupted human and natural systems. Past and current  development  trends  (past  emissions,  development  and  climate  change)  have  not  advanced  global climate resilient development […]. Societal choices and actions implemented in the next decade determine the extent to which medium-and long-term pathways will deliver higher or lower climate resilient development […]. Importantly climate resilient development prospects are increasingly limited if current greenhouse gas emissions do not rapidly decline, especially if 1.5°C global warming is exceeded in the near term […]. These prospects are constrained by past development, emissions and climate change, and enabled by inclusive governance, adequate and appropriate human and technological resources, information, capacities and finance […].”

IPCC WGII Sixth Assessment Report – Summary for Policymakers, SPM.D.5

Références

Working Group II of the IPCC (27-02-2022) Climate change 2022 Impacts, Adaptation and Vulnerability [PDF File], IPCC. https://www.ipcc.ch/report/ar6/wg2/downloads/report/IPCC_AR6_WGII_SummaryForPolicymakers.pdf

IPCC climate report: is it alarming?

Par Kenny Chicate-Moibert, André Naegely-Hofstetter, Florian Girardot, Maria Smetanina, Julien Brocard, Paul Frere, Manon Lombardet, étudiants ESTA Belfort, 05/2022

Mots clés: #IPCC #climate change #global warming

What is the IPCC?

The IPCC prepares a comprehensive assessment of the current state of scientific, technical and socioeconomic knowledge on climate change, its impacts and future risks, and options for reducing climate change. It also produces reports on issues agreed by member governments, as well as methodological reports that provide guidance for the preparation of greenhouse gas inventories. The IPCC is preparing the Sixth Assessment Report, which consists of three working group papers and a synthesis report. The WG1 contribution was completed in August 2021, and the WG2 contribution was completed in February 2022.

IPCC 1 group : Impact

Definition of the environmental impact, how to calculate it with the carbon footprint, how does the IPCC calculate it with their data (digging in their previous reports to find the most accurate parts and global stats that we can add in order to make our article the clearest it can be.

Give a brief first glance on how the IPCC predicts our future in the coming years (the 5 different scenarios regarding the climate in the coming years), so that we can develop each single scenario individually afterwards.

Current climate conditions and the IPCC Scénarios

Current climate conditions

There is no doubt that human influence has warmed the atmosphere, ocean and land. Rapid and significant changes have occurred in the atmosphere, ocean, cryosphere and biosphere.

100% of global warming is due to human activity. This is a certain and unequivocal fact (to understand what radiative forcing is, read this article).

The magnitude of recent changes in the overall climate system and the current state of many aspects of the climate system are unprecedented, ranging from hundreds to thousands of years.

Over the past three thousand years, sea level has not risen as rapidly as it has since 1900

Since the first IPCC report was published in 1990, 1,000 billion tons of carbon dioxide have been emitted. That’s almost half of our emissions since the beginning of the entire industrial era.

Human activity is warming the climate at a rate not seen in at least 2,000 years. Recent climate change has been widespread, rapid and intensified. Compared to 1850-1900, temperatures have increased by 1.1°C in the last 10 years.

Human-induced climate change has affected many extreme weather and climate events in all regions of the world. Evidence of changes in extreme events such as heat waves, heavy rainfall, droughts, and tropical cyclones, especially their attribution to human influence, has increased since AR5.

We will develop the different scenarios.

The IPCC Scénarios (Intergovernmental Panel on Climate Change)

SSP1-1.9 : The addition of the CO2 concentration in the atmosphere of from -18 Gita Tons of CO2 per year, -9 Megatons of Methane per year, 8 Megatons of Nitrous oxide per year and 4 Megatons of Sulphur dioxide per year will lead to a global surface temperature increase from 1,2°C to 1,9°C

SSP1-2.6 : The addition of the CO2 concentration in the atmosphere of from -9 Gita Tons of CO2 per year, -9 Megatons of Methane per year, 8 Megatons of Nitrous oxide per year and 4 Megatons of Sulphur dioxide per year will lead to a global surface temperature increase from 1,4°C to 2,6°C

SSP2-4.5 : The addition of the CO2 concentration in the atmosphere of from 5 Gita Tons of CO2 per year, 8 Mega Tons of Methane per year, 240 Megatons of Nitrous oxide per year and 31 Megatons of Sulphur dioxide per year will lead to a global surface temperature increase from 2°C to 3,5°C

SSP3-7.0 : The addition of the CO2 concentration in the atmosphere of from 82 Gita Tons of CO2 per year, 790 Mega Tons of Methane per year, 21 Megatons of Nitrous oxide per year and 79 Megatons of Sulphur dioxide per year will lead to a global surface temperature increase from 2,6°C to 4,6°C

SSP5-8.5 : The addition of the CO2 concentration in the atmosphere of from 125 Gita Tons of CO2 per year, 490 Mega Tons of Methane per year, 16 Megatons of Nitrous oxide per year and 35 Megatons of Sulphur dioxide per year will lead to a global surface temperature increase from 3,2°C to 5,7°C

Average estimations from the following graphics :

Fig 1 : Future annual emissions of CO2 (left) and of a subset of key non-CO2 drivers (right), accross five illustrative scenarios
Fig 2 : Contribution to global surface temperature increase from different emissions, with a dominant rôle of CO2 emissions

From IPCC’s AR6 WGI full report

The IPCC’s Average estimations of temperatures evolution on Near term, Mid-term and Long-terme :

Near-term : 2021 – 2040

Mid-term : 2041 – 2060

Long-term : 2081 – 2100

From the best estimation to the worst one.

Note : Best estimation is the average temperature between the best one and the worst one.

Fig 3 : Comparative board

All SSP scenarios predict that the Earth will warm by 1.5°C. The most ambitious emission projections predict that we will reach 1.5°C in the 2030s, then peak at +1.6°C, before falling back to 1.4°C by the end of the century.

The problem is that we know that the technology needed to achieve negative emissions at these orders of magnitude does not exist or has never been tested at this scale.

Information on future climate change and its consequences

Under scenarios of increasing CO2 emissions, oceanic and terrestrial carbon sinks will be less effective in slowing the accumulation of CO2 in the atmosphere

The IPCC describes the evolution of future temperatures according to 5 different socio-economic pathways (SSP)

In all emission scenarios (except the lowest one, SSP1-1.9), we will exceed the global warming threshold of +1.5°C in the near future (between 2021 and 2040) and remain above +1.5°C until the end of the century.

Fig 4 : Near-linear relationship between cumulative CO2 emissions and the increase in global surface temperature

With continued warming, each region could experience more extreme weather events, sometimes in combination, and with multiple consequences. This is more likely to happen with +2°C warming than 1.5°C (and even more so with additional warming levels). Translate « combined » as « several at once » (heatwave, followed by megafires for example, as in Canada in June 2021).

Tipping points are included in the report because, although they have a lower probability of occurring, they could have devastating consequences. Low-probability events, such as ice sheet melt, abrupt changes in ocean currents (e.g., AMOC), some cumulative extreme events, and warming significantly greater than the range of warming estimated to be very likely, cannot be excluded and are included in the risk assessment.

The glaciers in the mountains and at the poles are doomed to melt for decades or even centuries to come, while the release of carbon from the permafrost by thawing, considered over a period of more than 1000 years, is irreversible.

Limiting climate change in the future

In order to limit global warming, strong, rapid and sustainable actions will be needed to reduce CO2, methane and other greenhouse gas emissions. This would not only reduce the consequences of climate change but also improve air quality.

Limiting global warming to +1.5°C will no longer be possible without an immediate and large-scale reduction of GHG emissions (see the different scenarios).

If we reach carbon neutrality, global warming should stop (with more certainty than in the previous report).

Many changes due to past and future greenhouse gas emissions are irreversible for centuries or even millennia, including changes in the oceans, ice caps, and global sea level. However, some changes can be slowed and some stopped by limiting global warming.

Estimates of the remaining carbon budget – a simplified way of assessing how much CO2 can be released before a given level of warming is reached – have been improved since previous reports, but the carbon budget remains broadly unchanged.

Change projection :

Projected changes are shown at global warming levels of 1°C, 1.5°C, 2°C, and 4°C and are relative to 1850-1900 representing a climate without human influence. The figure depicts frequencies and increases in intensity of 10-year or 50-year extreme events from the base period (1850-1900) under different global warming levels. (Too change and explain properly)

Attribution of extreme events

Very significant progress has been made since the last IPCC attribution report. It is science that tells us whether we can attribute extreme weather events to climate change. Here is what the IPCC told us:

« Human-induced climate change has affected many extreme weather and climate events in all regions of the world. Since AR5, evidence of changes in extreme events such as heat waves, heavy rainfall, droughts, and tropical cyclones, particularly their impact on the attribution of human influence, has been strengthened. »

The global proportion of major tropical cyclones (categories 3 to 5) may have increased over the past four years.

It is no longer necessary to talk about the effects of climate change on all events in general; for example, we can estimate how much human activity has exacerbated a given heat wave (see also the work on global weather attribution)

The IPCC is the first to describe the observed increase in extreme hurricanes. Previously, these changes were too uncertain to have international consensus. Extreme weather events are now becoming more severe in all regions of all continents (with the exception of southern South America, where data is too sparse).

Here is an excellent infographic that expresses the probability of different extreme events based on possible warming:

Fig 5 : Projected changes in extremes are larger in frequency and intensify with every additional increment of global warming

Regionality of climate change

The IPCC also points out that « natural factors and internal variability will moderate anthropogenic changes, particularly on a regional scale and in the short term, with little effect on centennial climate warming ». These adjustments are important when planning for any possible changes, especially for risk management.

Based on the 2 temperatures proposed by the IPCC (+2°C and +4°C), it is clear how differently things are warming on Earth.

Fig 6 : a) Comparison of observed and simulated annual mean surface temperature change             b) Simulated annual mean temperature change (°C)
Fig 7 : c) Precipitation change (%) d) Total column soil moisture change (standard deviation of interannual variability)

The second diagram shows the rise in water levels caused by global warming. We therefore notice that the more the climate changes, the more the consequences on our lives (rising sea levels, temperature increases) the more difficult our living conditions will be.

Proportion of CO2 emissions

Fig 8 : Cumulative anthropogenic CO2 emissions taken up by land and ocean sinks by 2100 under the five illustratives scenarios

The graph above shows the division of CO2 emissions between 3 different spaces (ocean, land, atmosphere) according to the 5 scenarios from 1850 to 2100. From this graph, we can observe that it is in the atmosphere that global warming will have the most impact. Indeed, it is in the atmosphere that there is the biggest difference according to the scenarios. However, we must not forget that the oceans and the land will also be affected by these changes.

Global surface temperature changes in °C (referral : 1850-1900)

Fig 9 : Global surface temperature change in °C  relative to 1850-1900

In all scenarios the global temperature increases however we observe a high delta (about 3.5°C).

Arctic ice evolution and projections in 10^6 km²

Fig 10 : September Artic sea ice area in 10^6 km²

The global warming of the surface temperature leads to a melting of the ice. From the graph above, we can see that the ice melt is important. In 3 of the 5 scenarios, we can see that by 2100 we will be below the practically ice-free limit.

Sea level increasing projections in metters

Fig 11 : Global ocean surface pH (a measure of acidity)

Due to global warming and melting ice, the sea level is rising between 0.2 and 0.7 metters depending on the different scenarios until 2100.

Ocean acidity (pH) projections

Fig 12 : Global mean sea level change in meters relative to 1900

This graph shows us that the ocean acidity increase more and more strongly according to the different scenarios.

Synthesis and conclusion

According to climate scientists, our world is likely to continue to warm this century and beyond. The conclusion is based on scientists’ understanding of how the climate system works and computer models developed to simulate Earth’s climate. Results from various climate model simulations suggest that Earth’s average temperature in 2100 could be 1.1 to 5.4°C (2 to 9.7°F) warmer than it is today.

The main cause of the temperature increase is carbon dioxide and other heat-trapping « greenhouse gases » produced by human activities. The biggest source of extra carbon dioxide is people burning coal and other fossil fuels.

The exact amount of warming that will occur in the coming century depends largely on the energy choices that we make now and in the next few decades, particularly since those choices directly influence how fast we put heat-trapping gases into the atmosphere. And so we have to take care about the different consequences of this warming. These risks include sea level rise, leading to coastal flooding and erosion; changes to the salinity of coastal groundwater supplies, resulting in freshwater stress; risks to marine ecosystems, such as mass coral bleaching and die-offs; and more intense tropical cyclones. Limiting warming to 1.5 degrees Celsius will mean 40,000 less people will see their land inundated by 2150.

Références

IPCC AR6 WG (2021), Climate Change 2021 The Physical Science Basis, available from: https://www.ipcc.ch/report/ar6/wg1/downloads/report/IPCC_AR6_WGI_Full_Report.pdf

L’impact du cycle de vie d’un médicament sur l’environnement

Par Benyahia Chebel, Luca Di Nicola, Gabriel Khababa, Célia Messaoudi, Minthy Soumare, étudiants ESTA Belfort, 05/2021

Mots clés : #médicament #cycle #industrie #pharmaceutique #environnement #biodiversité #carbone #pollution

Soigner les Hommes en empoisonnant la planète : le paradoxe des géants de l’industrie pharmaceutique.

L’industrie pharmaceutique, 6ème marché économique mondial, est une industrie en constante augmentation. Depuis ses débuts, l’industrie pharmaceutique prend toujours plus d’importance dans le monde et voit ces chiffres augmenter d’année en année avec une croissance annuelle moyenne de 5%. L’industrie pharmaceutique se porte bien, avec 1200 milliards de dollars de chiffre d’affaires générés en 2019. Cette industrie se développe toujours plus grâce aux nouvelles technologies, aux avancées et découvertes scientifiques. De plus, elle est composée de nombreux acteurs qui jouent tous un rôle important allant de la conception à la fabrication d’un médicament. Aujourd’hui on compte plus de 4000 molécules actives ­­­à destination humaine ou vétérinaire. Une fois consommées, ces substances et leurs métabolites sont rejetés par l’organisme et se retrouvent plus ou moins directement dans l’environnement à travers les eaux usées des hôpitaux, des logements ou encore des exploitations agricoles.

La prise de conscience des industries pharmaceutiques a fortement progressé ces trente dernières années mais celle-ci est principalement concentrée sur les produits chimiques ainsi que les pesticides en délaissant les médicaments. La pollution des divers milieux comme les eaux, les sols et l’air par des résidus de produits pharmaceutiques représente actuellement un problème dans un monde où la protection de l’environnement est présente dans tous les discours. La consommation de médicaments à usage humain est comprise entre 50 et 150 g par personne et par an dans l’UE. Les médicaments à usage vétérinaire sont utilisés en plus petites quantités, mais les animaux de compagnie sont un segment croissant du marché des produits à usage vétérinaire. Dans la plupart des États membres de l’UE, sur l’ensemble des médicaments non utilisés (entre 3 et 8% de la quantité totale vendue), environ 50% n’est pas collecté.

La France fait partie des plus grands consommateurs de médicaments dans le monde, il est donc important de prendre compte de l’impact de cette consommation sur notre planète, et ceux de sa production à son élimination.

Un cycle de vie long et périlleux

Le temps nécessaire entre la découverte d’une molécule prometteuse et l’arrivée du médicament sur le marché est de l’ordre d’une dizaine d’années. Le cycle de vie du médicament est donc un chemin semé d’embuche et nécessitant un grand nombre de ressources quelques soit leur nature.

Les substances chimiques et autres résidus pharmaceutiques arrivent dans les domaines aquatiques par différentes voies, il est donc nécessaire d’étudier le cycle de vie du médicament et son devenir afin de mieux comprendre ses effets et son impact. Il s’agit ici non du déroulement de la genèse d’un médicament mais bel et bien de son « trajet » de sa production jusqu’à son évacuation. Le cycle commence par une étape de recherche et développement du médicament jusqu’à sa mise en production (1). Durant cette étape, de nombreuses molécules polluantes se retrouvent dans les eaux de déchet. Malgré un traitement accru de ses eaux il est tout de même possible de retrouver des traces de ces substances. Après la production, viennent les étapes de médecine humaine (2a) et animale (2b), où ces substances actives ne sont pas entièrement absorbées par l’organisme et donc excrétées par voies naturelles atteignant les stations d’épurations des eaux usées urbaines (3a). Les méthodes utilisées de nos jours dans le traitement des eaux des stations d’épuration ne sont pas 100% fiables car elles sont concentrées sur l’élimination des molécules biodégradables et nutritives telles que les composants phosphorés et azotés. Par conséquent, ces résidus peuvent passer à travers les stations d’épuration et atteindre les eaux de surface comme les rivières et les lacs. En conclusion, la présence de ces résidus pharmaceutiques, certes en faibles quantité peuvent être détectés dans les eaux de surface (4) ainsi que les eaux destinées à la production d’eau potable (5).

Figure 1 : Le cycle de vie des médicaments
Source : (Pills Project, 2012)

L’empreinte carbone du cycle de vie du médicament

L’industrie pharmaceutique émet une quantité astronomique de gaz à effet de serre chaque année. En effet, celle-ci s’élève à 52 MT de CO2 par an. D’après l’analyse du Professeur canadien Lotfi Belkhir, l’industrie pharmaceutique polluerait plus que l’industrie automobile, qui elle émet environ 46 MT de CO2 par an (Lotfi Belkhir, 2019).

Dans un premier temps, nous allons nous intéresser à l’empreinte carbone direct (c’est-à-dire de l’arrivée des matières premières dans l’usine, jusqu’au contrôle du produit fini).Dans un deuxième temps, nous nous intéresserons à l’empreinte carbone indirect (c’est à dire de la livraison à la délivrance).

Figure 2 : Émission de CO2 de l’entreprise Novartis
Source : (Novartis, 2017)

Nous avons choisi de prendre comme exemple l’entreprise Novartis, l’un des leaders mondiaux du marché pharmaceutique.

L’entreprise émet beaucoup de CO2 (1.258.558 T en 2017). Ses postes d’émissions les plus élevés sont respectivement : l’achat d’énergie, le processus de production et le transport suivi des émissions de CO2 venant des composés halogénés et non-halogénés.

Enfin, l’entreprise émet plus de 15 millions de mètres cube de vapeur d’eau chaque année. La vapeur eau représente donc la plus grande part des émissions de gaz à effet de serre émis par l’entreprise. Cependant, la vapeur d’eau n’étant pas très stable dans l’atmosphère, cela ne représente pas un problème d’un point de vue climatique.

Figure 3 : Intensité des émissions CO2 de l’industrie pharmaceutique en 2015
Source : (Lotfi Belkhir, 2019)

Le graphique ci-dessus représente une vision générale des émissions directes et indirectes de l’industrie pharmaceutique. Celui-ci représente les émissions de CO2 par milliards de dollars. Il est difficile de mettre tous les acteurs dans le même panier. En effet, l’entreprise Eli Lilly est 5,5 fois plus polluante que l’entreprise suisse Roche avec 14 tonnes CO2/M$. Dans la même lignée, Procter & Gamble émet 5 fois plus de CO2 que son concurrent direct Johnson & Johnson. Il en ressort finalement que Roche, Amgen et Johnson & Johnson sont largement en avance sur les objectifs fixés par la conférence du climat de 2015 qui est de retrouver un équilibre entre les besoins et les capacités de chaque pays en réduisant les émissions de gaz à effet de serre. Pour les autres, ils doivent réduire en moyenne leurs émissions de 59% d’ici 2025. D’après Lotfi Belkhir : ”Rien d’impossible, puisque Roche a par exemple augmenté ses revenus de 27,2 % entre 2012 et 2015 tout en réduisant ses émissions de 18,7 %.” (Belkhir, 2019)

Il est vrai qu’aujourd’hui, l’ensemble des laboratoires pharmaceutiques ont commencé à réduire leur émission carbone. Cela fait intégralement partie de leur stratégie RSE.

Les entreprises mettent en place des actions à tous les niveaux dans le cycle de vie et de production des médicaments pour diminuer les rejets de CO2. Depuis de nombreuses années maintenant, les entreprises ont mis en place des rapports et des stratégies de réduction de leur empreinte carbone. (Roche, 2019) Des installations pour diminuer l’utilisation de ressources primaires telles que l’eau ou l’électricité sont mise en place. Ils comptent également sur la responsabilisation de leurs employés en limitant les voyages d’affaires en avion qui représentent une part non négligeable des consommations carbone. L’objectif est de réduire l’empreinte CO2 liée aux employés des compagnies. Le suisse Roche est déjà très en avance sur ces questions.

L’impact du cycle de vie du médicament sur la chaine alimentaire, la biodiversité et par conséquent sur l’ensemble de l’écosystème

Il serait totalement inconcevable d’imaginer notre société sans eux : il s’agit des médicaments modernes et hyper efficaces. De nos jours, un très grand nombre de substances actives pharmaceutiques à des fins humains ou vétérinaires sont fabriquées par les entreprises pharmaceutiques.

À la suite des nouveaux progrès technologiques dans le domaine des soins médicaux, l’augmentation de l’espérance de vie ainsi que l’industrialisation dans le domaine de l’agriculture, c’est tout naturellement que la production et la consommation de médicament a augmenté. En effet, comme nous le remarquons sur la figure 4, la consommation de soins et de biens médicaux est passée de 6.3 à 203.5 milliards d’euros, en moins de cinquante ans (de 1970 à 2018). Dans ce chiffre on retrouve une consommation de médicament avoisinant les 33 milliards d’euros en 2018, ce qui explique donc naturellement l’augmentation de la pollution due à ces derniers.

Figure 4 : Représentation de l’évolution de la part de la consommation des soins et des biens médicaux, et de la consommation de médicaments dans le PIB
Source : (INSEE, 2020)

L’évolution considérable des progrès liés aux analyses physico-chimiques, a permis la détection de nombreux résidus de médicaments dans l’eau à des concentrations extrêmement basses, plusieurs fois inférieures à celles détectables il y a quelques années. D’après (Pills Project, 2012), il est désormais possible, grâce aux techniques d’analyses modernes, de détecter et mesurer les traces d’un morceau de sucre dissous dans un réservoir d’une contenance d’environ 2,7 milliards de litres d’eau soit l’équivalent de 19 millions de baignoires remplies.

Dans une proportion allant de 30% à 90% des cas, les médicaments administrés par voie orale sont dans la majorité excrétés sous forme de substances actives dans l’urine des animaux et des humains (SANCO, 2013). Ces rejets de substances médicamenteuses se font dans les lavabos et les toilettes ou les sols pour finir leur course dans la nature. Depuis plus de 40 ans, un nombre astronomique de molécules pharmaceutiques ont été retracées dans notre environnement en faible quantité (ng/L), plus particulièrement dans les eaux. En effet, selon les endroits des prélèvements les quantités ne sont pas exactement similaires. Il est question de quelques dizaines de ng/L dans les eaux de surface (nanogramme = 1 million de fois moins qu’un milligramme) et quelques centaines de ng/L dans les effluents de station d’épuration (= l’eau rejetée dans les rivières après traitement).

D’autres médicaments peuvent se dégrader selon des réactions physico-chimiques dans les sols et les eaux. Ces molécules passent entre les mailles du filet dans les stations d’épurations incapables d’éliminer de si petites quantités. Dans certain cas, il peut même se produire des transformations en métabolites actifs (composés organiques intermédiaires ou issus du métabolisme) au sein de ces installations. Certains de ces médicaments peuvent être absorbés dans les boues issues du traitement des eaux et leur devenir est incertain en cas d’épandage dans les sols agricoles.

À titre d’exemple une plaquette de dix comprimés de 50 mg de diclofénac peut polluer jusqu’à 5 millions de litres d’eau. (Gilard, 2020)  

Figure 5 :  Cycle du médicament de son administration à sa destination finale
Source : (Lecomte, 2013)

Les prélèvements les plus importants sont observés pour les médicaments anti-inflammatoires ainsi que les hypolipémiants représentant un traitement contre le cholestérol, et bien entendu le paracétamol. Encore une fois, cela n’est pas anodin et entre en parfaite corrélation puisqu’il s’agit des médicaments à forte consommation dans le monde. A titre d’exemple, le Doliprane (paracétamol) est le médicament le plus vendu en France.   Concernant leur différents devenir, certains médicaments liposolubles, c’est-à-dire soluble dans les graisses (lipides), peuvent se retrouver dans les tissus adipeux des animaux et s’introduire ainsi dans la chaîne alimentaire.  En effet, l’ensemble de ces molécules détectées ont un impact considérable sur la faune mondiale. Parmi les victimes, on note les poissons et les amphibiens qui, à leur insu ont subi de nombreux changements notamment à cause de la pilule contraceptive (présence de l’éthynylestradiol, perturbateur endocrinien). Cette dernière, se retrouve, via le processus expliqué ci-dessus, dans les cours d’eau et amène à une « féminisation » des espèces (Lecomte, 2013). Cela bouleverse complètement le cycle de reproduction des espèces et entrainera à long terme une diminution des populations allant même vers leur disparition. On relève également la présence de traces d’anti-dépresseur rendant les poissons plus vulnérables aux prédateurs.

Figure 6 :  L’hormone de la pilule affecte la reproduction des organismes aquatiques à des doses infimes
Source : (Jobling, 2004)

D’après la revue « nature » (Oaks, 2004), il a été observé une forte diminution des populations de vautours du Pakistan suite à la forte présence de résidus de Diclofénac, un anti-inflammatoire, dans leur organisme. En effet, en se nourrissant de bétails préalablement traités avec ce médicament ces rapaces accumulent ce composé dans leur organisme, qui entrainerait chez eux une insuffisance rénale pouvant aboutir à la mort de l’individu. Il existe des dizaines d’exemple de ce type, bouleversant de plus en plus la chaine alimentaire.

Au niveau de la production, les activités de recherche et développement de médicaments sont, pour la plupart du temps réalisées dans des pays développés. En revanche, les substances actives sont essentiellement produites dans les pays émergents, la pollution liées à la production se fait donc plus ressentir dans les zones émergentes. (Mudgal, 2013) De nos jours, à la suite des avancés dans le domaine des analyses physico-chimiques, des études ont montré que les rejets liés à la production de médicaments étaient bien plus élevés que les 2% estimés mais difficilement chiffrables précisément car il n’y a pas de réel suivi de ces émissions au cours du processus de production des médicaments.

Figure 7 : Nombre de produits pharmaceutiques détectés dans les eaux
Source : (Moghaddam, 2019)

Nous avons pu voir que la production, la consommation et les résidus de médicaments ont beaucoup d’impact sur notre planète. Malheureusement ceci ne s’arrête pas là, l’élimination des médicaments a aussi beaucoup d’impact sur notre climat. Selon l’IGAS (Inspection Générale des Affaires Sociales), un médicament sur deux n’est pas consommé, cela représente donc un grand gâchis au niveau de l’impact que la production de ces derniers a sur l’environnement. De plus les instances gouvernementales ont multiplié les programmes de reprise de médicaments pour inciter les personnes à rendre les médicaments en pharmacie plutôt que de s’en débarrasser dans les ordures ménagères. (Moghaddam, 2019) En mars 2017, un sondage mené par l’institut BVA pour Cyclamed a révélé que 79% des personnes interrogées rapporte leurs médicaments chez le pharmacien.

Malheureusement, il n’y a pas que les particuliers qui gaspillent des médicaments, les instances de santé telles que les hôpitaux ou les EHPAD sont aussi concernées à des échelles beaucoup plus grandes. Pour un hôpital on recense que 0,5 à 2% du budget annuel est dépensé dans des médicaments non-utilisés ou périmés. (Grass, 2005)

Mais où vont réellement tous ces médicaments lorsqu’ils sont rendus aux bons endroits ? Ces derniers sont tous simplement pris en charge par des usines spécifiques pour être ensuite incinérés. L’incinération est à ce jour la meilleure méthode pour réduire ce type de déchet d’après l’ONU bien que cela produit des émissions gazeuses toxiques qui seront relâchées dans notre atmosphère. (Moisan, 2020)

Nous avons pu voir que chaque étape du cycle de vie du médicament a une conséquence plus ou moins lourde sur notre biodiversité, sur notre environnement et donc sur notre planète. La production de ces médicaments reste essentielle pour soigner les Hommes mais à quel prix pour notre environnement ? Se soigner au détriment de notre planète est-ce la seule issue ?

Références

Anon., 2019. Leem. [En ligne]
Available at: https://www.leem.org/la-production-pharmaceutique-cest-quoi

Anon., s.d. Pills Project. [En ligne]
Available at: http://www.pills-project.eu/content/136/documents/110317_PillsBrochure-fr.pdf

Belkhir, L., 2019. L’industrie pharmaceutique émet plus de gaz à effet de serre que l’industrie automobile. [En ligne]
Available at: https://www.futura-sciences.com/planete/actualites/gaz-effet-serre-entreprises-pharmaceutiques-emettent-plus-co2-secteur-automobile-76257/

Gilard, P., 2020. Fédération maisons médicales santé et solidarité. [En ligne]
Available at: https://www.maisonmedicale.org/Quel-impact-environnemental.html
[Accès le Avril 2021 ].

Grass, E., 2005. « Enquête sur le dispositif de recyclage des médicaments Cyclamed », s.l.: s.n.

INSEE, 2020. Institut National de la Statistique et des Etudes Economiques. [En ligne], Available at: https://www.insee.fr/fr/statistiques/4277750?sommaire=4318291#tableau-figure7
[Accès le Avril 2021].

Jobling, 2004. Science Direct. [En ligne]
Available at: https://www.sciencedirect.com/science/article/pii/S0166445X04000037
[Accès le Avril 2021].

Lecomte, V., 2013. [En ligne]
Available at: https://ecotoxicologie.fr/medicaments-dangereux-environnement

Lotfi Belkhir, J. o. C. P. 2., 2019. Intensité carbone en Mt eCO2/M$). Journal of Cleaner Production.

Moghaddam, F., 2019. France Culture. [En ligne]
Available at: https://www.franceculture.fr/environnement/environnement-locde-alerte-sur-les-consequences-des-produits-pharmaceutiques#:~:text=Parmi%20les%20médicaments%20qui%20ont,exemple%20plus%20vulnérables%20aux%20prédateurs.
[Accès le Avril 2021].

Moghaddam, F., 2019. France Culture. [En ligne]
Available at: https://www.franceculture.fr/environnement/environnement-locde-alerte-sur-les-consequences-des-produits-pharmaceutiques#:~:text=Parmi%20les%20médicaments%20qui%20ont,exemple%20plus%20vulnérables%20aux%20prédateurs.

Moisan, D., 2020. L’incinération des déchets médicaux progresse et, avec elle, l’émission de produits toxiques. Le Monde.

Mudgal, S., 2013. Study on the environmental risks of medicinal, s.l.: Executive Agency for Health and Consumers.

Novartis, 2017. Novartis Environmental Data Supplement 2017, s.l.: s.n.

Oaks, 2004. Nature. [En ligne]
Available at: https://www.nature.com/articles/nature02317
[Accès le Avril 2021].

Pills Project, 2012. Pills Project. [En ligne]
Available at: http://www.pills-project.eu/content/136/documents/110317_PillsBrochure-fr.pdf

Roche, 2019. [En ligne]
Available at: https://www.roche.com/sustainability/fighting-climate-change.htm
[Accès le Avril 2021].

SANCO, D., 2013. Green Facts. [En ligne]
Available at: https://www.greenfacts.org/fr/produits-pharmaceutiques-environnement/index.htm
[Accès le Avril 2021].

Vivien Lecomte, 2013. Ecotoxicologie. [En ligne]
Available at : https://ecotoxicologie.fr/medicaments-dangereux-environnement
 [Accès le 5 Avril 2021].

Anon., 2015. Green Facts. [En ligne]
Available at : https://www.greenfacts.org/fr/produits-pharmaceutiques-environnement/index.htm
 [Accès le 10 Avril 2021].

L’énergie est notre avenir, biomimétisons la !

Par Camille Fernandes, Patrick Garnier, Julien Gaudry & Marie Petit, étudiant.e.s ESTA Belfort, 05/2021.

Mots clés : #biomimétisme #énergie #développement durable #innovation

Le biomimétisme est un terme qui regroupe l’ensemble des ingénieries inspirées du vivant. Ce terme vient du grec, βίος bíos (vie) et μίμησις mímêsis (imitation). Le terme biomimétisme apparaît pour la première fois en 1980. Il fut par la suite vulgarisé par la biologiste Janine Benyus, auteur de l’ouvrage Biomimicry : Innovation Inspired by Nature (Benyus, 1997). Le biomimétisme s’inspire des formes, des matières, des propriétés, des processus et des fonctions du monde vivant. Il concerne aussi bien l’échelle nanométrique que l’échelle macroscopique ou écosystémique. C’est donc un concept interdisciplinaire entre la chimie, la biologie et l’ingénierie, qui consiste à s’inspirer des solutions issues du vivant, dans le but de concevoir de nouvelles technologies durables et efficaces.

À une époque où le réchauffement climatique et le développement durable s’imposent comme des enjeux majeurs, l’Homme doit faire face à ces préoccupations environnementales et y trouver des solutions. Le biomimétisme permet des avancées technologiques dans de nombreux domaines, parmi lesquels l’innovation d’architecture et l’économie d’énergie. Le biomimétisme représente ainsi un réel moyen pour répondre à ces problématiques contemporaines.

Une étude de l’être vivant à 360°

Le biomimétisme s’applique à différents niveaux et sous-niveaux (figure 1). Chaque niveau du biomimétisme représente un levier d’innovation et de recherche.

Figure 1 : Les différents niveaux de biomimétisme.
Source : Natasha Chayaamor-Heil, François Guéna et Nazila Hannachi-Belkadi (2018)

Le niveau organique est un biomimétisme de forme ou de surface. Il correspond à l’imitation des formes que l’on trouve dans la nature. Le monde vivant évolue depuis plus de 3 milliards d’années. Leur morphologie s’est parfaitement adaptée à leur habitat naturel au cours du temps. Ce concept est tout particulièrement repris dans l’architecture, c’est par exemple le cas du cactus, comme nous le verrons ultérieurement. Mais c’est également le cas d’autres types d’ingénieries, comme les éoliennes. En effet, les ingénieurs se sont inspirés des baleines à bosses, dont les nageoires sont recouvertes bosselures situées sur le bord antérieur de leurs nageoires pectorales. La surface de leurs nageoires a été reproduite sur les pales des éoliennes (figure 2). Grâce à cette innovation, les parcs éoliens peuvent désormais produire jusqu’à 20 % d’énergie supplémentaire par vent faible.

Figure 2 : Comparaison entre une nageoire de baleine à bosse (gauche) et une pale d’éolienne améliorée (droite).
Source : Biomimesis (2016), consultée en avril 2021

Le niveau comportemental correspond à un biomimétisme de processus et de fonction. Il s’agit d’observer comment la nature fait pour réaliser une action, afin de la reproduire. Ici, ce n’est pas la structure de l’organisme qui est reproduit, mais bien son comportement. C’est par exemple le cas des termites, qui construisent leur habitat de façon à optimiser la température intérieure, nous le développerons par la suite.

Le niveau écosystème correspond à un biomimétisme cherchant à imiter des écosystèmes déjà présents dans la nature. Dans ce cas, l’Homme cherche à comprendre comment les espèces interagissent avec leur environnement, dans le but de produire un écosystème stable et durable. En effet, chaque organisme d’un écosystème produit un substrat profitable à son environnement. Par exemple, le Physarum Polycephal, une espèce de moisissures, a inspiré le réseau de transports de Mexico. Cet organisme inspiré les ingénieurs, par leur capacité à explorer leur environnement afin de trouver le chemin le plus court vers des sources de nourriture. L’Homme a reproduit ce schéma en développant un algorithme capable d’optimiser tout un réseau de transport, en réduisant le nombre de lignes de celui-ci, tout en maximisant son efficacité. L’algorithme prend en compte simultanément la géographie, la densité de la population et les éventuels incidents qui peuvent se produire sur le réseau.

Le biomimétisme au cœur des stratégies de développement et d’innovation

Le biomimétisme est reconnu comme étant une méthodologie d’innovation privilégiée dans le domaine de la recherche scientifique. Le Ministère de la Transition Ecologique promeut le biomimétisme depuis 2014 pour le développement de nouvelles solutions durables à l’avenir. Le CEEBIOS – Centre d’études et d’expertises en biomimétisme – est un partenaire clé du gouvernement pour la recherche scientifique en faveur de la transition écologique et du développement durable. De nombreuses régions comme Nouvelle-Aquitaine ont signé un partenariat avec le CEEBIOS pour utiliser le biomimétisme « comme levier de développement et de croissance durable des entreprises régionales ». L’association a accompagné plus de 50 projets publiques et privés de R&D dans des secteurs à fort impact environnemental, comme la filière énergie représentée par EDF, Engie ou Eiffage.

Le cabinet de conseil NewCorp Conseil propose une matrice du biomimétisme stratégique (figure 3) illustrant les différents domaines d’applications du biomimétisme. Couplé à l’analyse du bureau d’étude VertigoLab Europe, il en ressort 4 axes principaux d’innovation :

  • L’innovation produit : le développement de produits améliorés ou nouveaux produits répondant à des besoins d’amélioration économique, sociale, environnementale ou utilitaire ;
  • L’innovation de procédé : le développement de nouveaux procédés d’industrialisation permettant d’améliorer et/ou de mieux balancer les facteurs de technicité, de coût, de rapidité, de consommation d’énergie ou d’impact environnemental ;
  • L’innovation d’organisation : le développement d’écosystèmes plus performant au sein d’organisations ;
  • L’innovation de stratégie : le développement de nouvelles stratégies d’entreprises (RSE) ou de commercialisation ;
Figure 3 : La matrice du biomimétisme stratégique par NewCorp Conseil
Source : NewCorp Conseil (2020)

L’accélération de l’innovation et du développement par le biomimétisme s’appuie sur deux axes principaux : l’observation de mécanismes issus de vie organique et la mise en place de méthodologies. AskNature est une base de données créée par l’institut européen Biomimicry afin de rassembler les études et observations réalisées sur les êtres vivants. Les données sont open-source et comprennent les analyses micro et macro-organiques des êtres vivants et leurs interactions avec un ou plusieurs écosystèmes.

Après s’être intéressé à un phénotype spécifique, il est nécessaire de poser une phase de réflexion afin de déterminer quelles applications peuvent être améliorées grâce aux procédés biomimétiques. Cette phase de recherche est encadrée par plusieurs méthodologies (TRIZ, ASIT, BioASIT, etc.) montrant chacune des forces et des faiblesses en matière d’innovation et de développement durable. Les principales méthodes utilisées sont :

  • La méthode BioTRIZ : cette méthode se base sur la modification de la matrice TRIZ, proposant l’identification et la résolution de contraintes techniques à partir de 40 principes de conception. La matrice BioTRIZ reprend ce précepte en proposant l’application de principes avérés du biomimétisme. C’est un outil d’application de concepts biomimétiques au service de l’innovation ;
  • La méthode C-K : cette méthode permet de partir d’un concept (produit, service, procédé, etc.) existant pour établir des concepts (C) non-exploitées à partir de connaissances (K) disponibles. La méthode permet la décomposition fonctionnelle d’un concept afin d’émettre de nouvelles hypothèses de conception en les associant à d’autres concepts utilisant ces mêmes hypothèses.

Et si nous nous inspirions des termites pour ne plus utiliser la climatisation ?

Le EastGate Center à Harare, au Zimbabwe, est un très bon exemple de biomimétisme appliqué au développement durable. En effet, cet immeuble ne possède pas l’air conditionné, mais il est autonome à 90% et il consomme 35% d’énergie en moins par rapport à d’autres immeubles du pays. Ce centre commercial et immeuble de bureaux, construit par Mike Pearce et ouvert en 1996, est inspiré des termitières qui peuvent atteindre parfois plusieurs mètres de haut. Ce bâtiment fonctionnel et innovant compile différents systèmes de ventilation inspirés des diverses structures de termitières (figure 4).

Figure 4 : Exemples de deux modèles de ventilation de monticules. A gauche, flux par thermosiphon ; à droite, flux induit.
Source : Zillante et al. (2010)

Les termites utilisent des systèmes de ventilation qui leur permet de garder leur habitat au frais. Lorsqu’il fait 40°C dehors, l’intérieur ne dépasse jamais 30°C. Pour cela, elles creusent le long de la paroi des petits trous qui n’endommagent pas la structure de la termitière, ni ne la fragilisent, tout en laissant ainsi circuler l’air. Les trous les plus proches du sol servent d’entrée à l’air frais. Celui-ci remonte ensuite dans la termitière au fur et à mesure qu’il se réchauffe. Les trous supérieurs permettent ensuite l’évacuation de l’air chaud vers l’extérieur.

Figure 5 : L’EastGate Center, inspiré par les termitières, consomme 35% d’énergie en moins que les autres bâtiments du pays.
Source : Huot, A., (2018)

À l’image des termitières, ce bâtiment a été construit à partir de dalles en béton et de briques qui sont deux matériaux résistants, permettant d’absorber beaucoup de chaleur sans induire de grandes variations de température à l’intérieur du bâtiment. La chaleur est ensuite rétrocédée durant la nuit évitant ainsi une trop forte baisse de température dans les locaux. À l’inverse, la fraîcheur nocturne est accumulée et sera restituée le lendemain pour limiter la hausse de la température. De plus, tout comme les cactus, l’EastGate Center est équipé de nombreuses petites fenêtres, dont aucune n’est exposée directement au soleil, limitant ainsi les gains de chaleur durant la journée et améliorant les pertes de chaleur pendant la nuit (figure 5). Cette auto-régulation permet de réduire grandement l’utilisation d’équipements tierces et la consommation continue d’énergie.

Afin d’assurer un renouvellement de l’air au cours de la journée ainsi qu’une température suffisante, le patio est surplombé par une verrière ouverte au vent permettant une rentrée d’air. En outre, des ventilateurs à faible consommation d’énergie permettent de faire remonter l’air frais de la nuit dans les planchers des 7 étages du bâtiment. L’air chaud généré est également dirigé dans ces conduites et sera par la suite évacué par l’une des 48 cheminées que compte l’immeuble, suivant exactement le même principe que les termitières.

C’est donc en s’inspirant de la nature que l’EastGate Center et arrive à maintenir une température inférieure à 30°C en journée et 15°C pendant la nuit sans avoir recours à la climatisation. Une telle efficacité énergétique, appliquée à grande échelle, représenterait un atout clé pour le développement durable.

Comment le cactus a-t-il inspiré les ingénieurs pour optimiser la consommation d’énergie ?

La faune et la flore du désert ont stimulé plusieurs études pour la collecte de l’eau. Basée sur des principes dérivés des scarabées du désert du Namib des cactus et des sarracénies, qui combine de manière synergique ces aspects de la condensation (figure 6).

Figure 6 : Captation de l’eau chez les êtres vivants.
Source : Park et al., 2016

Ces études ont mené à la conception de nouveaux matériaux innovants et de structures permettant la condensation ainsi que le guidage de l’eau récupérée pour une utilisation en architecture dans des zones de stress hydrique intenses, la diminution de l’énergie nécessaire pour les distillations dans l’industrie grâce à ces revêtements qui facilitent la condensation, etc.

L’exemple du cactus est le parfait exemple d’applications multiples des caractéristiques d’un végétal pour aider l’Homme pour des défis de captation de vapeurs. En effet, les systèmes d’aiguilles du cactus permettent de condenser, capter et diriger les vapeurs. Cet aspect technique est utilisé par exemple en architecture pour capter l’humidité et pour mieux gérer les échanges thermiques. Autre exemple le projet de bâtiment pour le Ministère de l’Agriculture du Qatar. Le bâtiment est conçu pour avoir une efficacité énergétique optimale en climat aride, le système de volet pare-soleil permettent d’économiser des frais de climatisations (figure 7 gauche).

Un autre projet architectural nommé Ecotone à Paris pour 2024 qui reprend beaucoup de concepts de biomimétisme comme la ventilation naturelle de la structure à la manière d’une pomme de pin permettant des économies d’énergie significatives (figure 7 droite). Le projet en forme de colline recouverte à 40% de végétaux permet de filtrer « naturellement » l’eau par ruissellement.

Figure 7 : Ministère de l’Agriculture du Qatar (gauche) et Ecotone (droite)
Source : URBEO, 2015 & Louis Delafon, 2020

L’architecture s’est souvent inspirée de la nature pour sa beauté, mais les avancées de la science en termes d’observation permettent aux architectes de s’inspirer de celle-ci pour résoudre des problèmes techniques et répondre aux problématiques du développement durable.

Les avancées et l’avenir du biomimétisme

Le biomimétisme est donc une source d’inspiration intarissable. Les solutions pour lutter contre le réchauffement climatique et pour favoriser le développement durable semblent être à portée de main, quelque part dans la nature. Les applications du biomimétisme n’ont aucune limite : l’architecture, le transport, la médecine, les nouvelles technologies, le développement de nouveaux matériaux, et autres. Les progrès de toutes ces sciences pourraient être fulgurants à l’avenir. Cependant, la plupart des gouvernements, des laboratoires de recherche et des entreprises n’ont pas encore pris conscience du potentiel de ce concept trop peu connu, et pourtant prometteur.

Les avancées sur le sujet sont lentes, comparées à l’accélération du réchauffement climatique et des problèmes environnementaux. La question suivante persiste : « L’étude des êtres vivants et le biomimétisme sont-ils des solutions pertinentes pour accélérer le développement durable et la transition énergétique ? »

Références

Arnoux, F., (2017) 5 minutes pour comprendre C-K une méthode pour manager l’innovation ! [en ligne]. France : Stim. [Consulté en Avril 2021]. Disponible depuis : https://www.wearestim.com/fr/blog/5-minutes-pour-comprendre-c-k/.

Binet, T., Colle, A., Martin, J-C., Piquer, L., (2017) Evaluation du potentiel de développement de la biomimétique en région Nouvelle-Aquitaine [en ligne]. France : Vertigo Lab. [Consulté en Avril 2021]. Disponible depuis : http://vertigolab.eu/wp-content/uploads/2018/01/Rapport-biomim%C3%A9tisme-en-NA_VF.pdf.

Biomimicry Institute., (2018) Biological Strategies [en ligne]. Etats-Unis : Asknature.org. [Consulté en Avril 2021]. Disponible depuis : https://asknature.org/biological-strategies.

Chayaamor-Heil, N., Guéna, F., Hannachi-Belkadi, N. (2018), Biomimétisme en architecture. État, méthodes et outils [en ligne]. France : OpenDdition journals [Consulté en Avril 2021]. Disponible depuis : https://journals.openedition.org/craup/309. https://doi.org/10.3917/nect.010.0130

Développement durable illustré (2016), Biomimétisme : innovation inspirée par la nature (exemples) [en ligne]. France : Youtube. [Consulté en Avril 2021]. Disponible depuis : https://www.youtube.com/watch?v=wRdIleKwT9Q.

Huot, A., (2018), Biomimétisme : la clim’ de cet immeuble est inspirée par les termites [en ligne], France : L’ADN Tendances [consulté en Avril 2021] Disponible depuis : https://www.ladn.eu/nouveaux-usages/maison-2050/biomimetisme-la-clim-de-cet-immeuble-est-inspiree-par-les-termites/.

Jarfe (2021), Biomimétisme [en ligne]. France : Wikipédia. [Consulté en Avril 2021]. Disponible depuis : https://fr.wikipedia.org/wiki/Biomim%C3%A9tisme#:~:text=Le%20biomim%C3%A9tisme%20d%C3%A9signe%20un%20processus,processus%20et%20fonctions%20du%20vivant.

Louis Delafon, (2020). Ecotone : le bâtiment qui s’inspire de la nature [en ligne]. France : Paris Match. [Consulté en Avril 2021]. Disponible depuis : https://www.parismatch.com/Actu/Environnement/Ecotone-le-batiment-qui-s-inspire-de-la-nature-1716609

Mayer, N., (2018), Biomimétisme [en ligne]. France : Futura Sciences. [Consulté en Avril 2021]. Disponible depuis : https://www.futura-sciences.com/sciences/definitions/physique-biomimetisme-14960/.

Ministère de la Transition Ecologique., (2019) Le biomimétisme [en ligne]. France : Ecologie.gouv.fr. [Consulté en Avril 2021]. Disponible depuis : https://www.ecologie.gouv.fr/biomimetisme.

National Geographic, (2018), See How Termites Inspired a Building That Can Cool Itself | Decoder [en ligne] France : Youtube [consulté en Avril 2021] Disponible depuis : https://www.youtube.com/watch?v=620omdSZzBs&t=110s.

Park, K.-C., Kim, P., Grinthal, A., He, N., Fox, D., Weaver, J.C., Aizenberg, J., (2016). Condensation on slippery asymmetric bumps. Nature 531, 78–82. [Consulté en Avril 2021]. Disponible depuis : le doi 10.1038/nature16956 ou https://doi.org/10.1038/nature16956

Renaudin, A., (2020) Le monde d’après existe, il ya 3,8 milliards d’années ! [en ligne]. France : NewCorp Conseil. [Consulté en Avril 2021]. Disponible depuis : https://newcorpconseil.com/2021/01/17/le-monde-dapres-existe-il-a-38-milliards-dannees.

Rocfort, M., Panet, C., Delande, R., Serrau, C., (2015), L’Eastgate Building, « le bâtiment termitière » [en ligne] France [consulté en Avril 2021] Disponible depuis : https://biomimetisme.wordpress.com/le-biomimetisme-dans-lhabitat/.

Terrier, P., Glaus, M., Raufflet, E., (2017) Biomimétisme : outils pour une démarche écoinnovante en ingénierie [en ligne]. France : OpenEdition Journals. [Consulté en Avril 2021]. Disponible depuis : le doi 10.400/vertigo.17914 ou https://journals.openedition.org/vertigo/17914.

URBEO, (2015) Architecture biomimétique [en ligne]. France : Calameo. [Consulté en Avril 2021]. Disponible depuis : https://www.calameo.com/read/002595223b76153823070

Zillante, G., Pullen, S., Wilson, L., Davidson, K., Chileshe, N., Zuo, J., Arman, M., (2010) Industrialised, Integrated, Intelligent sustainable Construction [en ligne] France : University of Adelaide [consulté en Avril 2021] Disponible depuis: https://digital.library.adelaide.edu.au/dspace/bitstream/2440/84302/2/hdl_84302.pdf.